Konica Minolta 2009 Annual Report Download - page 6
Download and view the complete annual report
Please find page 6 of the 2009 Konica Minolta annual report below. You can navigate through the pages in the report by either clicking on the pages listed below, or by using the keyword search tool below to find specific information within the annual report.-
 1
1 -
 2
2 -
 3
3 -
 4
4 -
 5
5 -
 6
6 -
 7
7 -
 8
8 -
 9
9 -
 10
10 -
 11
11 -
 12
12 -
 13
13 -
 14
14 -
 15
15 -
 16
16 -
 17
17 -
18
-
19
-
20
-
21
-
22
-
23
-
24
-
25
-
26
-
27
-
28
-
29
-
30
-
31
-
32
-
33
-
34
-
35
-
36
-
37
-
38
-
39
-
40
-
41
-
42
-
43
-
44
-
45
-
46
-
47
-
48
-
49
-
50
-
51
-
52
 |
 |
4
Millions of yen
Thousands of
U.S. dollars
(Note 1)
2009 2008 2009
For the Year:
Net sales ¥947,843 ¥1,071,568 $9,649,221
Operating income 56,260 119,606 572,737
Net income 15,179 68,829 154,525
Capital expenditure 61,164 75,295 622,661
R&D costs 81,904 81,370 833,798
At Year-End:
Total assets ¥918,058 ¥970,538 $9,346,004
Total net assets 414,284 418,310 4,217,490
Yen
U.S. dollars
(Note 1)
Per Share of Common Stock:
Net income—basic ¥ 28.62 ¥129.71 $0.29
Net assets 779.53 786.20 7.94
Cash dividends 20 15 0.20
Percent
Financial Ratios (Note 2):
Equity ratio 45.0% 43.0%
Return on assets 6.2 12.7
Return on equity 3.7 17.5
Profile
Notes: 1. U.S. dollar amounts above and elsewhere in this report for the Company are
translated from yen, for convenience only, at the rate of ¥98.23=US$1, the
approximate exchange rate prevailing at March 31, 2009.
2. Equity ratio = (Total net assets – minority interests – share subscription rights)
÷ total assets × 100 (%)
Return on assets = (Operating income + interest and dividend income)
÷ average total assets × 100 (%)
Return on equity = Net income ÷ average (total net assets – minority interests
– share subscription rights) × 100 (%)
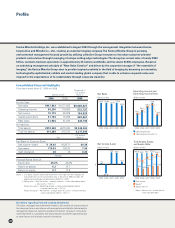
Konica Minolta Holdings, Inc. was established in August 2003 through the management integration between Konica
Corporation and Minolta Co., Ltd., creating an essential imaging company. The Konica Minolta Group is pursuing
environmental management-focused growth by utilizing collective Group resources to introduce customer-oriented
products and services through leveraging of unique cutting-edge technologies. The Group has annual sales of nearly ¥950
billion, conducts business operations in approximately 40 nations worldwide and has about 37,000 employees. Based on
an underlying management principle of “New Value Creation” and driven by the corporate mes sage of “the essentials of
imaging”, the Konica Minolta Group aims to provide inspired creativity in the field of imaging by becoming an innovative,
technologically sophisticated, reliable and market-leading global company that is able to enhance corporate value and
respond to the expectations of its stakeholders through corporate creativity.
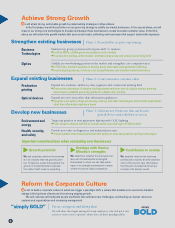
Operating income
Operating income ratio (%)
1,071.6
947.8
* Equity = Total net assets – minority interests
– share subscription rights
Net Sales
Operating Income and
Operating Income Ratio
83.4
119.6
(Billions of Yen) (Billions of Yen)
0
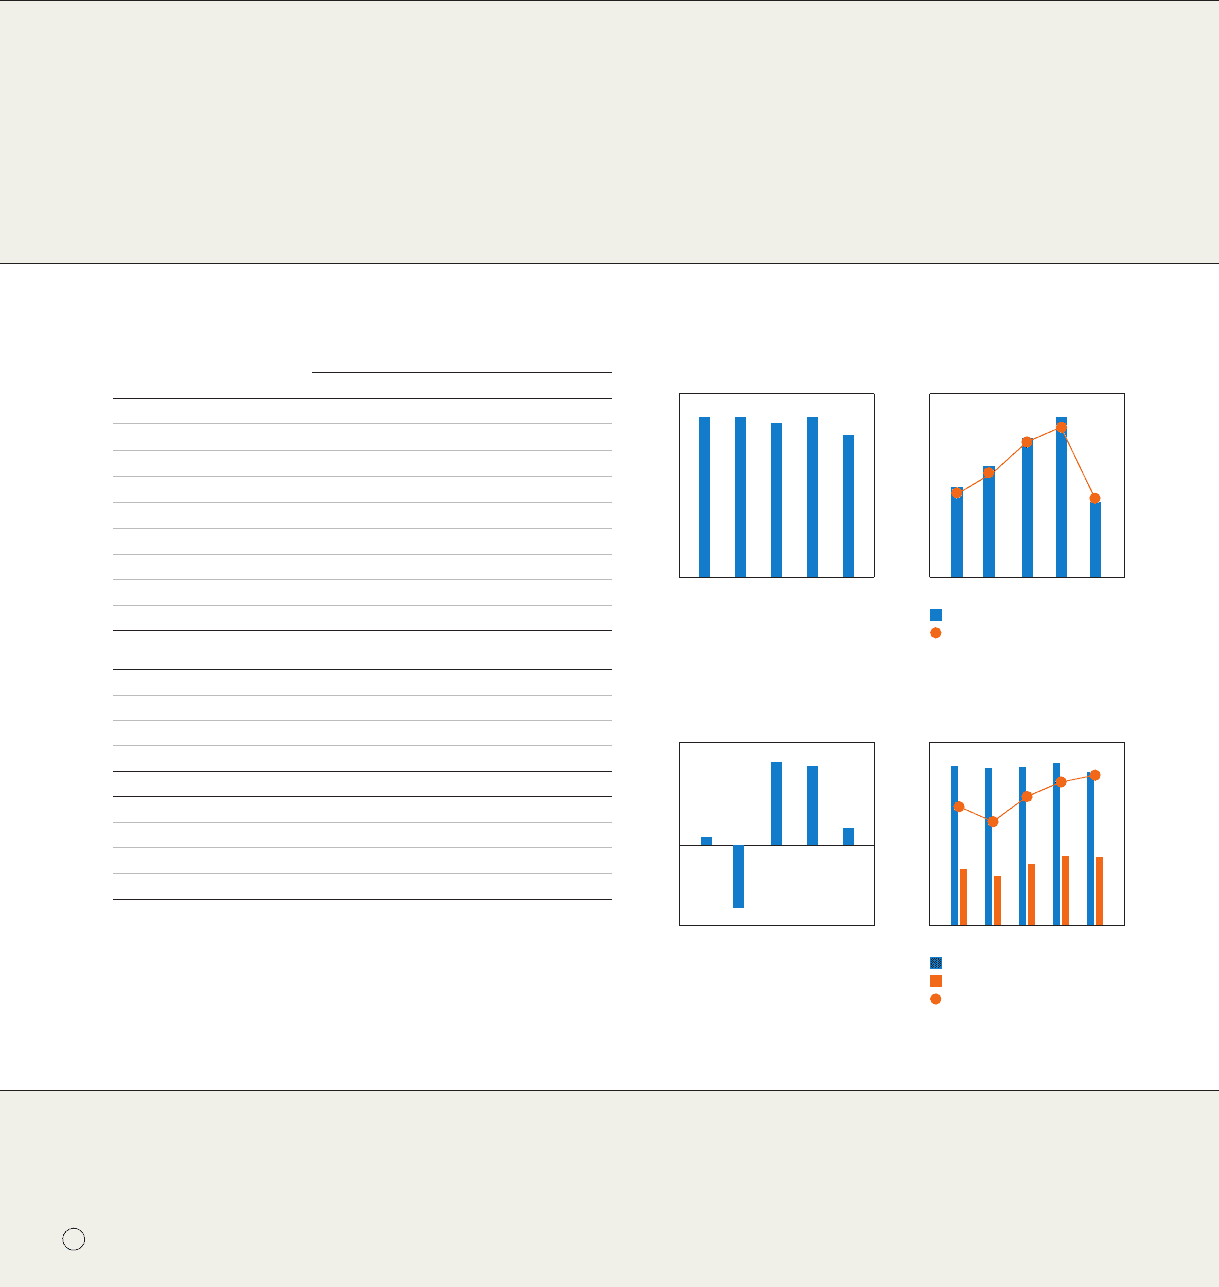
Total assets
Equity*
Equity ratio (%)
Net Income (Loss)
955.5 918.1
367.5
339.7 293.8
413.4
417.2
(Billions of Yen) (Billions of Yen)
1,027.6
1,067.4 1,068.4
67.6
104.0
72.5
7. 5
(54.3)
15.2
68.8
56.3
6.3
7. 8
45.0
43.0
38.6
Total Assets, Equity
and Equity Ratio
5.9
11.2
10.1
970.5
951.1
944.1
31.1
35.6
200720062005 2008 2009
200720062005 2008 2009 200720062005 2008 2009
200720062005 2008 2009
Consolidated Financial Highlights
Fiscal years ended March 31, 2009 and 2008
Disclaimer regarding Forward-Looking Statements
The plans, strategies and statements related to the outlook for future results in
this document are in accordance with assumptions and beliefs deter mined by
management based on currently available information. However, it should be
noted that there is a possibility that actual results could differ significantly due
to such factors as social and economic conditions.