Konica Minolta 2009 Annual Report Download - page 17
Download and view the complete annual report
Please find page 17 of the 2009 Konica Minolta annual report below. You can navigate through the pages in the report by either clicking on the pages listed below, or by using the keyword search tool below to find specific information within the annual report.
1515
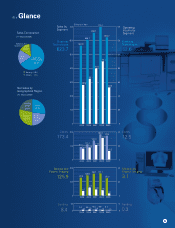
Sales Composition
(FY March 2009)
(FY March 2009)
Net Sales by
Geographical Region
Japan
North
America
Europe
27.1%
Asia and
Other
21.3%
28.7%
22.9%
0.9%
1.7%
Business
Technologies
Optics
Others
Sensing
Medical and
Graphic Imaging
65.8%
18.3%
13.3%
Business
Technologies
Optics
Medical and
Graphic Imaging
(Billions of Yen)
91.7 110.4
139.0
173.4
173.4
129.9
146.6 158.7
125.9
125.9
5.3 8.4
5.8 10.0
564.8
623.7
Business
Technologies
Optics
Medical and
Graphic Imaging
12.5
3.1
Sensing
8.4
Sensing
0.3
52.6
182.3
161.1
9.9
701.0
606.7
658.7
2005 2006 2007 2008 2009
2005 2006 2007 2008 2009
2005 2006 2007 2008 2009
2005 2006 2007 2008 2009
0
200
0
50 10
40
100 20
00
200 40
100 20
00
140700
120600
100500
80400
60300
40200
20100
00
Sales by
Segment Operating
Income by
Segment
3.1
6.7
11.7
8.9 7. 8
52.6
55.8
65.1
80.0
90.1
12.5
16.0 17.6
21.0
31.3
0.3
1. 6 1. 9 1. 6 1. 2
623.7
At a
Glance


