Konica Minolta 2009 Annual Report Download - page 46
Download and view the complete annual report
Please find page 46 of the 2009 Konica Minolta annual report below. You can navigate through the pages in the report by either clicking on the pages listed below, or by using the keyword search tool below to find specific information within the annual report.-
 1
1 -
2
-
3
-
4
-
5
-
6
-
7
-
8
-
9
-
10
-
11
-
12
-
13
-
14
-
15
-
16
-
17
-
18
-
19
-
20
-
21
-
22
-
23
-
24
-
25
-
26
-
27
-
28
-
29
-
30
-
31
-
32
-
33
-
34
-
35
-
 36
36 -
 37
37 -
 38
38 -
 39
39 -
 40
40 -
 41
41 -
 42
42 -
 43
43 -
 44
44 -
 45
45 -
 46
46 -
 47
47 -
 48
48 -
 49
49 -
 50
50 -
 51
51 -
 52
52
 |
 |

44
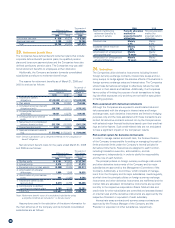
(2) Loss on disposal of inventories
As noted earlier in “Summary of Significant Accounting Policies”, effective from the year ended March 31, 2009, the Company and its consolidated subsid-
iaries recognize the loss on disposal of inventory as cost of sales, following accounting policy review caused by the introduction of adoption of ASBJ
Statement No. 9, “Accounting Standards for Measurement of Inventories”, issued by the ASBJ on July 5, 2006. As a result of this change, the North
America figures, the Europe figures and the Asia and Other figures for operating expenses increased ¥995 million, ¥1,140 million and ¥470 million,
respectively, when compared to the previous method. And also these geographical segments figures for operating income decreased by the same amount.
5. Change in Method for Calculation of Depreciation of Tangible Fixed Assets
As noted earlier in “Summary of Significant Accounting Policies”, pursuant to an amendment to the Japanese Corporate Tax Law (Ordinance No. 32 of the
Ministry of Finance Japan (April 30, 2008)), effective from the year ended March 31, 2009, the Company and its domestic consolidated subsidiaries changed
the useful lives of machinery and equipment. As a result of this change, the Japan figures for operating expenses increased ¥6,587 million when compared to
the previous method. And also the Japan figures for operating income decreased by the same amount.
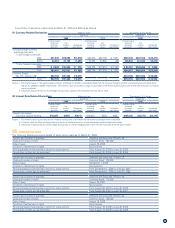
Millions of yen
Japan North America Europe Asia and Other Total
Eliminations and
Corporate Consolidated
2008: Net sales
External ¥469,989 ¥233,834 ¥305,687 ¥ 62,056 ¥1,071,568 ¥ – ¥1,071,568
Intersegment 353,597 2,848 868 204,822 562,136 (562,136) –
Total 823,586 236,683 306,555 266,879 1,633,704 (562,136) 1,071,568
Operating expenses 702,701 235,561 296,079 261,940 1,496,282 (544,320) 951,962
Operating income ¥120,885 ¥ 1,122 ¥ 10,476 ¥ 4,938 ¥ 137,422 ¥ (17,815) ¥ 119,606
Assets ¥722,432 ¥108,208 ¥162,036 ¥ 91,278 ¥1,083,956 ¥(113,418) ¥ 970,538
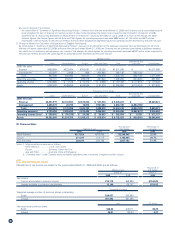
Thousands of U.S. dollars
Japan North America Europe Asia and Other Total
Eliminations and
Corporate Consolidated
2009: Net sales
External $4,451,919 $2,143,592 $2,515,830 $ 537,870 $ 9,649,221 $ – $9,649,221
Intersegment 2,856,419 26,794 19,872 1,951,094 4,854,189 (4,854,189) –
Total 7,308,338 2,170,386 2,535,702 2,488,975 14,503,410 (4,854,189) 9,649,221
Operating expenses 6,739,296 2,255,635 2,515,484 2,430,032 13,940,456 (4,863,972) 9,076,484
Operating income (loss) $ 569,042 $ (85,239) $ 20,208 $ 58,933 $ 562,954 $ 9,783 $ 572,737
Assets $6,292,589 $1,254,759 $1,358,312 $ 879,874 $ 9,785,554 $ (439,540) $9,346,004
(3) Overseas Sales
Millions of yen
Thousands of
U.S. dollars
Percentage of
net sales
2009 2008 2009 2009
North America ¥217,024 ¥245,486 $2,209,345 22.9%
Europe 271,797 312,115 2,766,945 28.7%
Asia and Other 202,074 225,182 2,057,152 21.3%
Notes: 1. Major countries or areas are as follows:
North America ..................U.S.A. and Canada
Europe .............................Germany, France and U.K.
Asia and Other .................Australia, China and Singapore
2. “Overseas sales” is the Company and consolidated subsidiary sales in countries or regions outside of Japan.
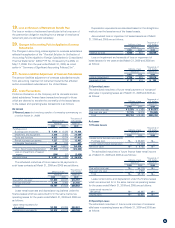
27. Net Income per Share
Calculations of net income per share for the years ended March 31, 2009 and 2008, are as follows:
Millions of yen
Thousands of
U.S. dollars
March 31 March 31
2009 2008 2009
Net income
Income attributable to common shares ¥15,179 ¥68,829 $154,525
Income available to common stockholders 15,109 68,757 153,812
Thousands of shares
Weighted average number of common shares outstanding:
Basic 530,437 530,660
Diluted 561,462 561,580
Yen U.S. dollars
Net income per common share:
Basic ¥28.62 ¥129.71 $0.29
Diluted 26.91 122.44 0.27