Konica Minolta 2009 Annual Report Download - page 40
Download and view the complete annual report
Please find page 40 of the 2009 Konica Minolta annual report below. You can navigate through the pages in the report by either clicking on the pages listed below, or by using the keyword search tool below to find specific information within the annual report.-
 1
1 -
2
-
3
-
4
-
5
-
6
-
7
-
8
-
9
-
10
-
11
-
12
-
13
-
14
-
15
-
16
-
17
-
18
-
19
-
20
-
21
-
22
-
23
-
24
-
25
-
26
-
27
-
28
-
29
-
 30
30 -
 31
31 -
 32
32 -
 33
33 -
 34
34 -
 35
35 -
 36
36 -
 37
37 -
 38
38 -
 39
39 -
 40
40 -
 41
41 -
 42
42 -
 43
43 -
 44
44 -
 45
45 -
 46
46 -
 47
47 -
 48
48 -
 49
49 -
 50
50 -
51
-
52
 |
 |

38
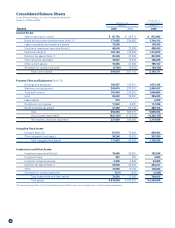
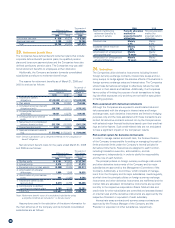
9. Inventories
Inventories as of March 31, 2009 are as follows:
Millions of yen
Thousands of
U.S. dollars
March 31 March 31
Merchandise and finished goods ¥ 87,796 $ 893,780
Work in process 19,003 193,454
Raw materials and supplies 22,360 227,629
Total ¥129,160 $1,314,873
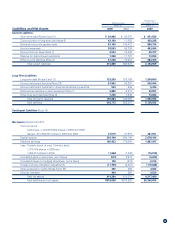
10. Contingent Liabilities
The Companies were contingently liable at March 31, 2009 for loan
and lease guarantees of ¥2,076 million ($21,134 thousand) and at
March 31, 2008 for loan and lease guarantees of ¥3,266 million.
11. Collateral Assets
Assets pledged as collateral for short-term debt of ¥198 million
($2,016 thousand) and long-term debt of ¥146 million ($1,486
thousand) are notes receivable of ¥753 million ($7,666 thousand).
12. Research and Development Costs
Research and development costs included in cost of sales and
selling, general and administrative expenses for the years ended
March 31, 2009 and 2008 are ¥81,904 million ($833,798 thousand)
and ¥81,370 million, respectively.
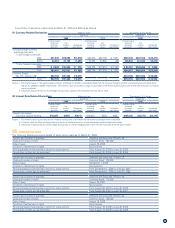
13. Loss on Impairment of Fixed Assets
The Companies have recognized loss on impairment of ¥1,168 mil-
lion ($11,890 thousand) and ¥5,702 million for the following groups of
assets for the years ended March 31, 2009 and 2008, respectively:
Description Classification Amount
Millions of yen
Thousands of
U.S. dollars
March 31 March 31
2009 2008 2009
Manufacturing
facilities of
microlens for
mobile phone
Machinery and
equipment, Tools
and furniture,
Lease assets*
¥ 778 ¥ – $ 7,920
Manufacturing
facilities of
medical and
graphic film etc.
Machinery and
equipment, Tools
and furniture,
Others
103 2,361 1,049
Rental assets Rental business-
use assets
149 91 1,517
Idle assets Land, Buildings
and structures,
Machinery and
equipment, Others
137 328 1,395
Others Goodwill –2,921 –
Total ¥1,168 ¥5,702 $11,890
(1) Identifying the cash-generating unit to which an asset belongs:
Each cash-generating unit is identified based on product lines
and geographical areas as a group of assets. For rental assets,
cash-generating units are identified based on rental contracts
and each geographical area. Each idle asset is also identified as
a cash-generating unit.
(2) The Companies have written the assets down to the recoverable
value and recognized an impairment loss due to restructuring of
microlens manufacturing facilities in the Optics business,
worsening of the market environment in the Medical and
Graphic business, etc., and the decline in real estate value, poor
performance and profitability of rental and idle assets.
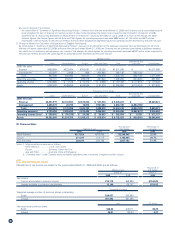
(3) Details of impairment of fixed assets
Amount
Millions of yen
Thousands of
U.S. dollars
March 31 March 31
2009 2008 2009
Machinery and equipment ¥648 ¥2,451 $6,597
Rental business-use assets 149 – 1,517
Lease assets* 198 – 2,016
Goodwill –2,921 –
Others 172 330 1,751
(4) Measuring recoverable amount
The recoverable amount of a cash-generating unit is the fair
value less costs to sell. The fair value is supported by an
appraisal report for land and buildings and structures, or a
management estimate for rental business-use assets.
* Lease assets
These lease assets are finance leased assets that do not transfer
ownership, for which the starting date for the lease transaction is prior
to March 31, 2008, and lease payments are recognized as expenses.
14. Discontinued Operations
The amounts included in the statements of income for discon tinued
operations for the years ended March 31, 2009 and 2008 represent:
Amount
Millions of yen
Thousands of
U.S. dollars
March 31 March 31
2009 2008 2009
Reversal of excess reserve made
for discontinued operations
in the previous fiscal year ¥1,412 ¥ 8,425 $14,374
Loss on discontinued operations
in the fiscal year under review (480) (7,834) (4,886)
Gain on discontinued operation ¥ 932 ¥ 590 $ 9,488
15. Patent-Related Income
Regarding patent-related income, amounts for patent royalities
related to the Photo Imaging business are recorded.
16. Cost of Sales
The cost of sales includes the cut-down of book values by ¥6,302
million ($64,156 thousand), by a low price method caused by
a decline of profitability and the lower of cost or market value.
17. Gain on Sales of Investments in Affiliated Companies
and Gain on Transfer of Business
The gain on sales of investments in affiliated companies and gain
on transfer of business resulted from the transfer of a domestic
subsidiary and related business assets belonging to the Medical
and Graphic Imaging business to a company outside the Group.
18. Business Structure Improvement Expenses
The business structure improvement expenses consist mainly of
retirement allowances, etc., associated with staff allocation/
optimization in the Business Technologies business, expenses on
business reorganization in the Medical and Graphic Imaging
business, and expenses on the reorganization of manufacturing
facilities in the Optics business.