Konica Minolta 2009 Annual Report Download - page 28
Download and view the complete annual report
Please find page 28 of the 2009 Konica Minolta annual report below. You can navigate through the pages in the report by either clicking on the pages listed below, or by using the keyword search tool below to find specific information within the annual report.-
 1
1 -
2
-
3
-
4
-
5
-
6
-
7
-
8
-
9
-
10
-
11
-
12
-
13
-
14
-
15
-
16
-
17
-
 18
18 -
 19
19 -
 20
20 -
 21
21 -
 22
22 -
 23
23 -
 24
24 -
 25
25 -
 26
26 -
 27
27 -
 28
28 -
 29
29 -
 30
30 -
 31
31 -
 32
32 -
 33
33 -
 34
34 -
 35
35 -
 36
36 -
 37
37 -
 38
38 -
39
-
40
-
41
-
42
-
43
-
44
-
45
-
46
-
47
-
48
-
49
-
50
-
51
-
52
 |
 |

Optics
Sales dropped 4.9%, or ¥8.8 billion, to ¥173.4 billion. We per-
formed well in the first half of the fiscal year by concentrating
on expanding revenues for such strategic products as VA-TAC
films, in which we dominate rivals, and optical pickup lenses for
Blu-ray format. Orders for these offerings plunged from the third
quarter, however, as many digital appliance manufacturers
slashed production.
Operating income fell 59.9%, or ¥18.7 billion, to ¥12.5 billion.
This stemmed from the sales decline and increased deprecia-
tion expenses owing to Japanese tax law reforms. These factors
outweighed more intense efforts to restructure and optimize
our domestic plants and reduce fixed costs.
Medical and Graphic Imaging
Sales decreased 21.9%, or ¥35.2 billion, to ¥125.9 billion. This
was primarily because film sales plunged amid a significant
reduction in worldwide demand.
Operating income was down 60.3%, or ¥4.7 billion, to ¥3.1
billion, as a fall in gross profit from lower unit sales of film
overshadowed extensive cost-cutting efforts.
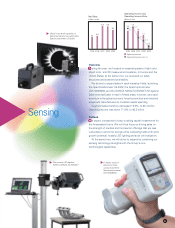
Sensing
Sales dropped 15.3%, or ¥1.5 billion, to ¥8.4 billion. Operating
income was down 71.4%, or ¥0.9 billion, to ¥0.3 billion. These
results stemmed from a rapid downturn in the global economy,
which forced manufacturers of automotive and electrical
equipment, and other equipment, to constrain capital spending.
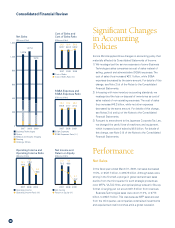
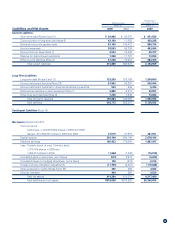
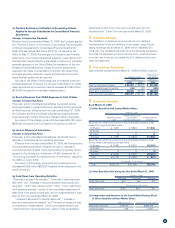
Financial Position
and Liquidity
Analysis of Assets, Liabilities, Net Assets,
and Cash Flows
Our financial position remained fundamentally firm in the fiscal
year under review from the medium- and long-term perspectives.
Despite ongoing reduction efforts over the medium and long
terms, interest-bearing debt stood at ¥230.4 billion at the close
of the year, up ¥4.4 billion. This was because we beefed up our
26
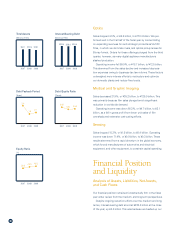
2007 2008 2009
3.4
1. 8 2.1
(Years)
Debt Payback Period
2007 2008 2009
229.4 226.0 230.4
(Billions of Yen)
Interest-Bearing Debt
2007 2008 2009
38.6 43.0 45.0
(%)
Equity Ratio
2007 2008 2009
0.62
0.54 0.56
(Times)
Debt /Equity Ratio
2007 2008 2009
951.1 970.5 918.1
(Billions of Yen)
Total Assets