Konica Minolta 2009 Annual Report Download - page 26
Download and view the complete annual report
Please find page 26 of the 2009 Konica Minolta annual report below. You can navigate through the pages in the report by either clicking on the pages listed below, or by using the keyword search tool below to find specific information within the annual report.-
 1
1 -
2
-
3
-
4
-
5
-
6
-
7
-
8
-
9
-
10
-
11
-
12
-
13
-
14
-
15
-
 16
16 -
 17
17 -
 18
18 -
 19
19 -
 20
20 -
 21
21 -
 22
22 -
 23
23 -
 24
24 -
 25
25 -
 26
26 -
 27
27 -
 28
28 -
 29
29 -
 30
30 -
 31
31 -
 32
32 -
 33
33 -
 34
34 -
 35
35 -
 36
36 -
37
-
38
-
39
-
40
-
41
-
42
-
43
-
44
-
45
-
46
-
47
-
48
-
49
-
50
-
51
-
52
 |
 |
Significant Changes
in Accounting
Policies
Konica Minolta applied three changes in accounting policy that
materially affected its Consolidated Statements of Income:
1) We recategorized the service expenses of some Business
Technologies sales companies as cost of sales instead of
selling, general and administrative (SG&A) expenses. The
cost of sales thus increased ¥28.1 billion, while SG&A
expenses decreased by the same amount. For details of this
change, see Note 2 (o) of the Notes to the Consolidated
Financial Statements.
2) In keeping with new inventory accounting standards, we
recategorized the loss on disposal of inventories as cost of
sales instead of non-operating expenses. The cost of sales
thus increased ¥6.3 billion, while net other expenses
decreased by the same amount. For details of this change,
see Notes 2 (e) and (p) of the Notes to the Consolidated
Financial Statements.
3) Pursuant to amendment to the Japanese Corporate Tax Law,
we changed the useful lives of machinery and equipment,
which increased cost of sales by ¥6.6 billion. For details of
this change, see Note 2 (f) of the Notes to the Consolidated
Financial Statements.
Performance
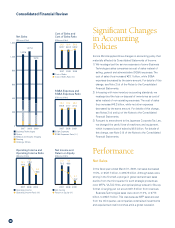
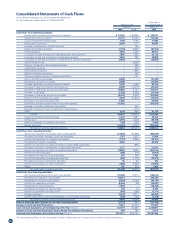
Net Sales
In the fiscal year ended March 31, 2009, net sales decreased
11.5%, or ¥123.7 billion, to ¥947.8 billion. Although sales were
strong in the first half, a plunge in global demand saw sales
decline from the third quarter for such strategic products as
color MFPs, VA-TAC films, and optical pickup lenses for Blu-ray
format. A surging yen cut around ¥81.3 billion from revenues.
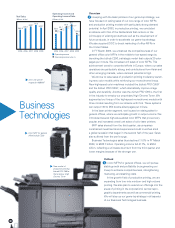
Business Technologies sales were down 11.0%, or ¥77.3
billion, to ¥623.7 billion. This was because MFP sales slowed
from the third quarter, as companies constrained investments
and experienced credit crunches amid a global recession.
Consolidated Financial Review
24
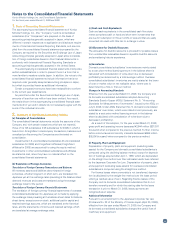
SG&A Expenses and
SG&A Expenses Ratio
2007 2008 2009
2007 2008 2009
0
1,000
1,200
600
800
400
200
1,027.6
947.8
1,071.6
Net Sales
532.7 540.2 520.2
51.8 50.4 54.9
390.9 411.7 371.4
38.0 38.4 39.2
(Billions of Yen) (Billions of Yen)
Cost of Sales
Cost of Sales Ratio (%)
Business Technologies
Optics
Medical and Graphic Imaging
Sensing
Holdings, Others
Cost of Sales and
Cost of Sales Ratio
2007 2008 2009
104.0
119.6
10.1
11.2
56.3
5.9
(Billions of Yen)
SG&A Expenses
SG&A Expenses Ratio (%)
2007 2008 2009
72.5 68.8
15.2
21.9 17.5
3.7
(Billions of Yen)(Billions of Yen)
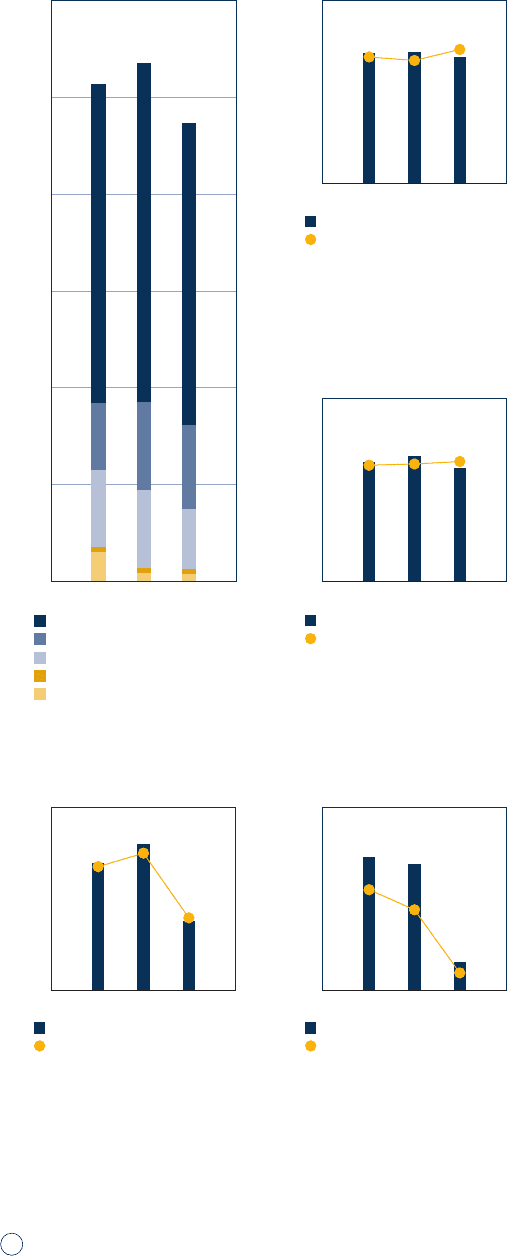
Net Income
Return on Equity (%)
Operating Income
Operating Income Ratio (%)
2007 2008 2009
Operating Income and
Operating Income Ratio
Net Income and
Return on Equity