Konica Minolta 2009 Annual Report Download - page 27
Download and view the complete annual report
Please find page 27 of the 2009 Konica Minolta annual report below. You can navigate through the pages in the report by either clicking on the pages listed below, or by using the keyword search tool below to find specific information within the annual report.-
 1
1 -
2
-
3
-
4
-
5
-
6
-
7
-
8
-
9
-
10
-
11
-
12
-
13
-
14
-
15
-
16
-
 17
17 -
 18
18 -
 19
19 -
 20
20 -
 21
21 -
 22
22 -
 23
23 -
 24
24 -
 25
25 -
 26
26 -
 27
27 -
 28
28 -
 29
29 -
 30
30 -
 31
31 -
 32
32 -
 33
33 -
 34
34 -
 35
35 -
 36
36 -
 37
37 -
38
-
39
-
40
-
41
-
42
-
43
-
44
-
45
-
46
-
47
-
48
-
49
-
50
-
51
-
52
 |
 |

Other Income and Expenses
Net other expenses increased 11.8%, or ¥2.4 billion, to ¥23.0
billion. The positive factors included recategorizing the loss on
disposal of inventories as part of the cost of sales, as men-
tioned earlier, gain on the Medical and Graphic Imaging busi-
ness’s sales of investments in affiliated companies and transfer
of business, and a significantly lower loss on impairment of
fixed assets. On the negative side, patent-related income
declined, the write-down of investment securities increased
owing to the stock market downturn, and we incurred higher
business structure improvement expenses, largely to optimize
personnel levels and reorganize businesses and plants.
Net Income
Net income was down 77.9%, or ¥53.7 billion, to ¥15.2 billion.
This was because while income before income taxes and
minority interests fell ¥65.8 billion owing to a plunge in
operating income, total income taxes decreased ¥12.0 billion.
Return on equity was therefore 3.7%, down by 13.8
percentage points from 17.5% a year earlier.
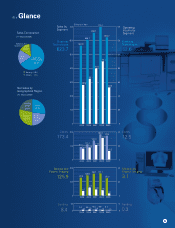
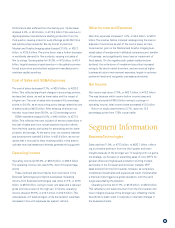
Segment Information
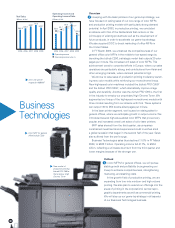
Business Technologies
Sales declined 11.0%, or ¥77.3 billion, to ¥623.7 billion, reflect-
ing a unit sales downturn from the third quarter and lower
margins because of the stronger yen. In keeping with our genre-
top strategy, we focused on expanding sales of color MFPs for
general offices and high-speed production printing models,
particularly in the European and American markets. MFP
sales slowed from the third quarter, however, as companies
constrained investments and experienced credit crunches after
a financial crisis triggered a global recession, with the yen’s
surge exacerbating the situation.
Operating income fell 41.7%, or ¥37.5 billion, to ¥52.6 billion.
This reflected a unit sales downturn from the third quarter and
lower margins because of the stronger yen, offsetting intensi-
fied efforts to slash costs in response to dramatic changes in
the business climate.
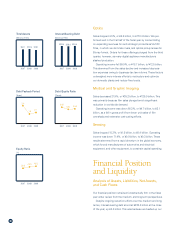
Performance also suffered from the soaring yen. Optics sales
dropped 4.9%, or ¥8.8 billion, to ¥173.4 billion. This was due to
digital appliance manufacturers slashing production from the
third quarter, causing orders for such offerings as VA-TAC films
and optical pickup lenses for Blu-ray format to plummet.
Medical and Graphic Imaging sales dropped 21.9%, or ¥35.2
billion, to ¥125.9 billion. The prime factor was a further decrease
in worldwide demand for film products, causing unit sales of
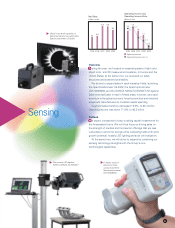
film to plunge. Sensing sales fell 15.3%, or ¥1.5 billion, to ¥8.4
billion, largely because a rapid downturn in the global economy
forced automotive and electrical equipment manufacturers to
constrain capital spending.
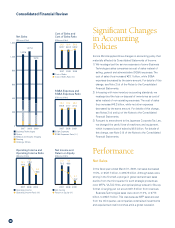
Cost of Sales and SG&A Expenses
The cost of sales decreased 3.7%, or ¥20.0 billion, to ¥520.2
billion. This reflected significant changes in accounting policies,
as described above, as well as lower sales and the impact of
a higher yen. The cost of sales ratio increased 4.5 percentage
points, to 54.9%, as an accounting policy change raised the cost
of sales by about ¥40.5 billion. After stripping this factor out,
the ratio would have been 50.6%, up 0.2 percentage point.
SG&A expenses dropped 9.8%, or ¥40.4 billion, to ¥371.4
billion. This reflected the new inclusion of service expenditure in
the cost of sales and more robust expense reduction efforts
from the third quarter, particularly for advertising and for trans-
portation and storage. At the same time, we boosted research
and development costs ¥0.5 billion, to ¥81.9 billion, as we rec-
ognize that it is crucial to keep investing solidly in this area to
cultivate new businesses and thereby generate strong growth.
Operating Income
Operating income fell 53.0%, or ¥63.3 billion, to ¥56.3 billion.
The operating income ratio was 5.9%, down 5.3 percentage
points.
These numbers stemmed mainly from downturns in the
Business Technologies and Optics businesses. Operating
income from Business Technologies was down 41.7%, or ¥37.5
billion, to ¥52.6 billion, owing to lower unit sales and a reduced
gross profit as a result of the high yen. In Optics, operating
income dropped 59.9%, or ¥18.7 billion, to ¥12.5 billion. This
was because unit sales plunged, while depreciation expenses
increased in line with Japanese tax system reforms.
25