Konica Minolta 2009 Annual Report Download - page 45
Download and view the complete annual report
Please find page 45 of the 2009 Konica Minolta annual report below. You can navigate through the pages in the report by either clicking on the pages listed below, or by using the keyword search tool below to find specific information within the annual report.-
 1
1 -
2
-
3
-
4
-
5
-
6
-
7
-
8
-
9
-
10
-
11
-
12
-
13
-
14
-
15
-
16
-
17
-
18
-
19
-
20
-
21
-
22
-
23
-
24
-
25
-
26
-
27
-
28
-
29
-
30
-
31
-
32
-
33
-
34
-
 35
35 -
 36
36 -
 37
37 -
 38
38 -
 39
39 -
 40
40 -
 41
41 -
 42
42 -
 43
43 -
 44
44 -
 45
45 -
 46
46 -
 47
47 -
 48
48 -
 49
49 -
 50
50 -
 51
51 -
 52
52
 |
 |

43
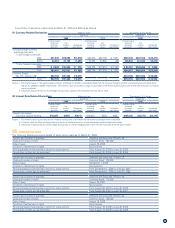
4. Change in Method for Calculation of Depreciation of Tangible Fixed Assets
As noted earlier in “Summary of Significant Accounting Policies”, pursuant to an amendment to the Japanese Corporate Tax Law (Ordinance No. 32 of the
Ministry of Finance Japan (April 30, 2008)), effective from the year ended March 31, 2009, the Company and its domestic consolidated subsidiaries changed
the useful lives of machinery and equipment. As a result of this change, the Business Technologies figures, the Optics figures, the Medical and Graphic
Imaging figures, the Sensing figures and the Other figures for operating expenses increased ¥379 million, ¥6,145 million, ¥54 million, ¥1 million and ¥5 million,
respectively, when compared to the previous method. And also these business segment figures for operating income decreased by the same amount.
Millions of yen
Business
Technologies Optics
Medical and
Graphic Imaging Sensing Other Total
Eliminations and
Corporate Consolidated
2008: Net sales
External ¥700,969 ¥182,262 ¥161,105 ¥ 9,910 ¥17,320 ¥1,071,568 ¥ – ¥1,071,568
Intersegment 5,175 1,083 3,566 768 62,798 73,392 (73,392) –
Total 706,145 183,345 164,671 10,678 80,119 1,144,961 (73,392) 1,071,568
Operating expenses 616,051 152,089 156,896 9,460 76,626 1,011,124 (59,162) 951,962
Operating income ¥ 90,093 ¥ 31,255 ¥ 7,775 ¥ 1,218 ¥ 3,493 ¥ 133,836 ¥ (14,229) ¥ 119,606
Assets ¥445,939 ¥181,938 ¥113,141 ¥ 9,505 ¥73,869 ¥ 824,394 ¥146,143 ¥ 970,538
Depreciation 31,286 15,968 6,048 293 1,996 55,593 4,850 60,443
Impairment losses 1,024 21 4,460 – – 5,506 195 5,702
Capital expenditure 16,588 42,012 4,595 370 2,468 66,035 9,259 75,295
Thousands of U.S. dollars
Business
Technologies Optics
Medical and
Graphic Imaging Sensing Other Total
Eliminations and
Corporate Consolidated
2009: Net sales
External $6,349,201 $1,765,408 $1,281,584 $85,442 $167,556 $ 9,649,221 $ – $9,649,221
Intersegment 42,024 10,710 24,626 6,057 599,206 682,633 (682,633) –
Total 6,391,225 1,776,127 1,306,210 91,510 766,762 10,331,864 (682,633) 9,649,221
Operating expenses 5,856,246 1,648,478 1,274,824 87,967 733,411 9,600,937 (524,453) 9,076,484
Operating income $ 534,979 $ 127,639 $ 31,386 $ 3,543 $ 33,350 $ 730,917 $ (158,180) $ 572,737
Assets $4,484,903 $1,590,991 $ 913,529 $82,714 $575,109 $ 7,647,256 $1,698,738 $9,346,004
Depreciation 306,159 286,481 44,131 3,319 23,832 663,942 50,484 714,436
Impairment losses 1,527 7,991 2,362 – – 11,890 – 11,890
Capital expenditure 243,490 280,882 32,078 3,115 22,977 582,551 40,100 622,661
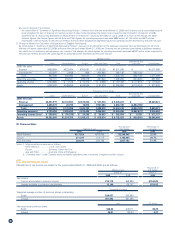
(2) Geographic Segment Information
Millions of yen
Japan North America Europe Asia and Other Total
Eliminations and
Corporate Consolidated
2009: Net sales
External ¥437,312 ¥210,565 ¥247,130 ¥ 52,835 ¥ 947,843 ¥ – ¥947,843
Intersegment 280,586 2,632 1,952 191,656 476,827 (476,827) –
Total 717,898 213,197 249,082 244,492 1,424,670 (476,827) 947,843
Operating expenses 662,001 221,571 247,096 238,702 1,369,371 (477,788) 891,583
Operating income (loss) ¥ 55,897 ¥ (8,373) ¥ 1,985 ¥ 5,789 ¥ 55,299 ¥ 961 ¥ 56,260
Assets ¥618,121 ¥123,255 ¥133,427 ¥ 86,430 ¥ 961,235 ¥ (43,176) ¥918,058
Notes:
1. Major countries or areas other than Japan are as follows:
North America ............... U.S.A. and Canada
Europe ........................... Germany, France and U.K.
Asia and Other ............. Australia, China and Singapore
2. Operating expenses not able to be properly allocated that are included in Eliminations and Corporate are principally R&D expenses incurred by the Company
and expenses associated with head office functions. Such expenses amounted to ¥31,297 million for the year ended March 31, 2009.
3. Included within the Eliminations and Corporate figure for assets are ¥202,373 million of corporate assets, which primarily include the holding company’s
surplus operating funds (cash and short-term investment securities) and long-term investment funds (investment securities) as well as other assets held by
the holding company.
4. Accounting Changes
(1) Accounting standards for measurement of inventories
As noted earlier in “Summary of Significant Accounting Policies”, effective from the year ended March 31, 2009, the Company and its domestic
consolidated subsidiaries adopted ASBJ Statement No. 9, “Accounting Standards for Measurement of Inventories”, issued by the ASBJ on July 5, 2006.
As a result of this adoption, the Japan figures for operating expenses increased ¥3,644 million when compared to the previous method. And also the Japan
figures for operating income decreased by the same amount.