Konica Minolta 2009 Annual Report Download - page 32
Download and view the complete annual report
Please find page 32 of the 2009 Konica Minolta annual report below. You can navigate through the pages in the report by either clicking on the pages listed below, or by using the keyword search tool below to find specific information within the annual report.-
 1
1 -
2
-
3
-
4
-
5
-
6
-
7
-
8
-
9
-
10
-
11
-
12
-
13
-
14
-
15
-
16
-
17
-
18
-
19
-
20
-
21
-
 22
22 -
 23
23 -
 24
24 -
 25
25 -
 26
26 -
 27
27 -
 28
28 -
 29
29 -
 30
30 -
 31
31 -
 32
32 -
 33
33 -
 34
34 -
 35
35 -
 36
36 -
 37
37 -
 38
38 -
 39
39 -
 40
40 -
 41
41 -
 42
42 -
43
-
44
-
45
-
46
-
47
-
48
-
49
-
50
-
51
-
52
 |
 |

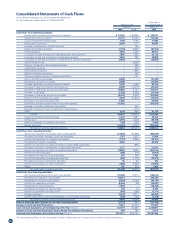
Consolidated Statements of Income
Konica Minolta Holdings, Inc. and Consolidated Subsidiaries
For the fiscal years ended March 31, 2009 and 2008
30
Millions of yen
Thousands of
U.S. dollars (Note 3)
March 31 March 31
2009 2008 2009
Net Sales ¥947,843 ¥1,071,568 $9,649,221
Cost of Sales (Notes 12 and 16) 520,206 540,225 5,295,796
Gross profit 427,637 531,343 4,353,426
Selling, General and Administrative Expenses (Note 12) 371,376 411,736 3,780,678
Operating income 56,260 119,606 572,737
Other Income (Expenses):
Interest and dividend income 2,176 2,643 22,152
Interest expenses (4,866) (4,465) (49,537)
Foreign exchange gain (loss), net (7,272) (7,637) (74,030)
Loss on sales and disposals of property, plant and equipment, net (2,866) (3,224) (29,176)
Write-down of investment securities (3,826) (313) (38,949)
Write-down of investment in affiliated companies –(54) –
Loss on disposal of inventories –(7,065) –
Gain on sales of investment securities, net 519 51
Gain on sales of investments in affiliated companies, net (Note 17) 2,803 47 28,535
Loss on impairment of fixed assets (Note 13) (1,168) (5,702) (11,890)
Gain on discontinued operations (Note 14) 932 590 9,488
Equity in net income (losses) of unconsolidated subsidiaries and affiliates (99) 182 (1,008)
Patent-related income (Note 15) 560 8,080 5,701
Gain on transfer of business (Note 17) 3,063 –31,182
Environmental expenses –(1,856) –
Other extraordinary losses of overseas subsidiaries –(1,731) –
Business structure improvement expenses (Note 18) (10,094) –(102,759)
Loss on revision of retirement benefit plan (Note 19) (2,046) –(20,829)
Other, net (336) (120) (3,421)
Total (23,035) (20,609) (234,501)
Income before income taxes and minority interests 33,224 98,996 338,227
Income Taxes (Note 7):
Current 13,183 29,496 134,205
Deferred 4,857 544 49,445
Total 18,040 30,040 183,651
Minority Interests in Net Income of Consolidated Subsidiaries 5 126 51
Net Income ¥ 15,179 ¥ 68,829 $ 154,525
Yen U.S. dollars (Note 3)
March 31 March 31
2009 2008 2009
Per Share Data (Notes 8 and 27):
Net income —Basic ¥28.62 ¥129.71 $0.29
—Diluted 26.91 122.44 0.27
Cash dividends 20 15 0.20
The accompanying Notes to the Consolidated Financial Statements are an integral part of these financial statements.