Konica Minolta 2009 Annual Report Download - page 29
Download and view the complete annual report
Please find page 29 of the 2009 Konica Minolta annual report below. You can navigate through the pages in the report by either clicking on the pages listed below, or by using the keyword search tool below to find specific information within the annual report.-
 1
1 -
2
-
3
-
4
-
5
-
6
-
7
-
8
-
9
-
10
-
11
-
12
-
13
-
14
-
15
-
16
-
17
-
18
-
 19
19 -
 20
20 -
 21
21 -
 22
22 -
 23
23 -
 24
24 -
 25
25 -
 26
26 -
 27
27 -
 28
28 -
 29
29 -
 30
30 -
 31
31 -
 32
32 -
 33
33 -
 34
34 -
 35
35 -
 36
36 -
 37
37 -
 38
38 -
 39
39 -
40
-
41
-
42
-
43
-
44
-
45
-
46
-
47
-
48
-
49
-
50
-
51
-
52
 |
 |

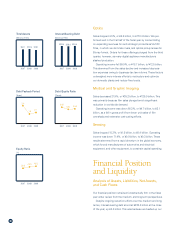
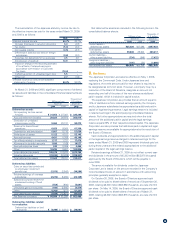
cash position to overcome financial market instability. Our
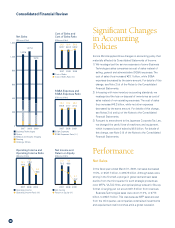
debt-to-equity ratio was 0.56 times, up 0.02 point. Shareholders’
equity was down ¥3.8 billion, at ¥413.4 billion, although the
equity ratio improved 2.0 percentage points, to 45.0%, as total
assets dropped significantly.
Despite sluggish operating results, our debt repayment indi-
ces weakened only slightly. The interest coverage ratio was 23.4
times, down 4.3 points. The debt payback period (operating cash
flows to interest-bearing debt) was 2.1 years, up from 1.8 years.
Our long-term debt ratings were unchanged.
As of March 31, 2009
Rating & Investment Japan Credit Rating
Information, Inc. Agency, Ltd.
Rating A– A
Outlook Positive Stable
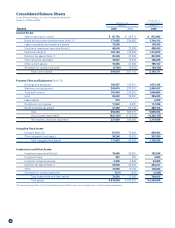
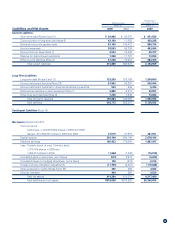
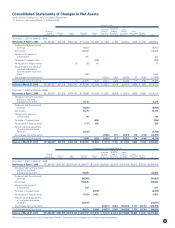
Assets, Liabilities, and Net Assets
At year-end, total assets were ¥918.1 billion, down ¥52.5 billion.
This was despite a ¥15.0 billion increase in short-term invest-
ment securities, and reflected a ¥63.0 billion decline in trade
notes and accounts receivable because of lower sales, an ¥18.1
billion drop in net property, plant and equipment owing to capital
spending constraints, and a ¥10.6 billion fall in investment
securities, reflecting an equity market downturn. Inventories
were down ¥3.8 billion, to ¥129.2 billion, as we scaled back
production in response to lower sales.
Total liabilities decreased ¥48.5 billion, to ¥503.8 billion. This
was due largely to a decrease in trade notes and accounts pay-
able because of production adjustments in line with lower sales.
Long-term loans payable soared, as we increased cash to cover
bond redemptions and loan repayments.
Net assets were ¥414.3 billion at year-end, down ¥4.0 billion.
This was because of a decrease in foreign currency translation
adjustments and a decline in the valuation difference on
available-for-sale securities owing to a stock market slump,
which offset an increase in retained earnings from the
contribution of ¥15.2 billion in net income.
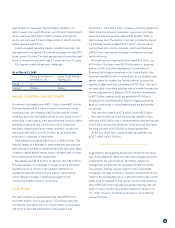
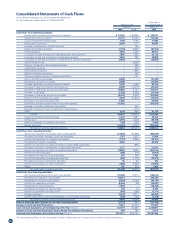
Cash Flows
Net cash provided by operating activities was ¥107.6 billion,
down ¥15.5 billion from a year earlier. The principal cash flow
contributors were ¥33.2 billion in income before income taxes
and minority interests, ¥70.2 billion in depreciation and
amortization, and a ¥36.7 billion increase in working capital from
trade notes and accounts receivable, inventories, and trade
notes and accounts payable, offset partly by ¥34.7 billion in
income taxes paid. The decline in net cash provided by operat-
ing activities reflected a ¥65.8 billion drop in income before
income taxes and minority interests, which overshadowed
a ¥34.0 billion improvement because of enhanced working
capital efficiency.
Net cash used in investing activities was ¥90.2 billion, up
¥13.4 billion. One factor was ¥28.0 billion spent in acquiring
shares in DOIC and other subsidiaries to boost sales of
Business Technologies operations in the United States. Also
important was ¥61.6 billion in expenditure to buy tangible fixed
assets, mainly to increase the Optics business’s production
capacity in glass hard disk substrates and TAC films. The rise in
net cash used in investing activities was principally because we
boosted acquisitions of shares in DOIC and other subsidiaries
by ¥21.2 billion, against which we generated ¥7.8 billion in
proceeds from the Medical and Graphic Imaging business’s
sales of investments in consolidated subsidiary and transfer
of business.
Free cash flow was thus ¥17.4 billion, down ¥28.8 billion.
Net cash provided by financing activities was ¥5.0 billion,
reflecting a ¥16.9 billion rise in interest-bearing debt and the use
of ¥9.3 billion to pay cash dividends. In the previous fiscal year,
we used net cash of ¥10.5 billion in financing activities.
At the end of the term, cash and cash equivalents were
¥133.7 billion, up ¥11.5 billion.
Regarding the anticipated business environment for the fiscal
year ending March 31, 2010, domestic and overseas economic
prospects for the year ahead are admittedly unclear, but
management expects that the operating climate will remain
very adverse. Despite recovery signs in some businesses,
companies will likely continue to constrain investments and cut
costs for the foreseeable future. It should therefore take consid-
erable time for demand to fully recover, as we focus heavily on
office MFPs and other business-to-business offerings. We will
need to closely monitor the possible impacts of trends in the
U.S. dollar, the euro, and other currencies on our operations
and performance.
27