Konica Minolta 2009 Annual Report Download - page 44
Download and view the complete annual report
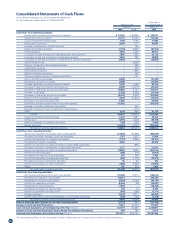
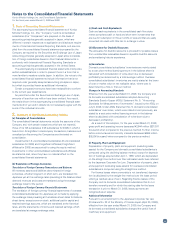
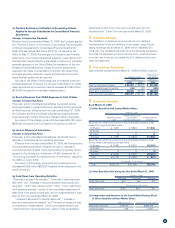
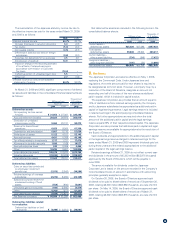
Please find page 44 of the 2009 Konica Minolta annual report below. You can navigate through the pages in the report by either clicking on the pages listed below, or by using the keyword search tool below to find specific information within the annual report.-
 1
1 -
2
-
3
-
4
-
5
-
6
-
7
-
8
-
9
-
10
-
11
-
12
-
13
-
14
-
15
-
16
-
17
-
18
-
19
-
20
-
21
-
22
-
23
-
24
-
25
-
26
-
27
-
28
-
29
-
30
-
31
-
32
-
33
-
 34
34 -
 35
35 -
 36
36 -
 37
37 -
 38
38 -
 39
39 -
 40
40 -
 41
41 -
 42
42 -
 43
43 -
 44
44 -
 45
45 -
 46
46 -
 47
47 -
 48
48 -
 49
49 -
 50
50 -
 51
51 -
 52
52
 |
 |

42
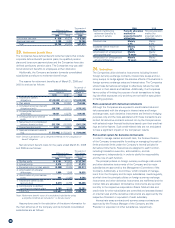
The following table summarizes the movement of outstanding stock options for the years ended March 31, 2009 and 2008.
Number of Shares
Stock options outstanding at March 31, 2007 297,000
Granted 113,000
Exercised 29,500
Forfeited 1,500
Stock options outstanding at March 31, 2008 379,000
Granted 128,000
Exercised 16,500
Forfeited 500
Stock options outstanding at March 31, 2009 490,000
The following table summarizes price information of stock options exercised during the period and outstanding stock options as of
March 31, 2009.
Per unit information Exercised Outstanding at March 31, 2009
Exercise price of stock options ¥ 1 ¥ 1
Average market price of the stock at the time of exercise 1,202 –
Fair value per unit (as of grant date) – 1,418
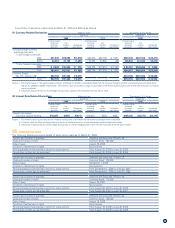
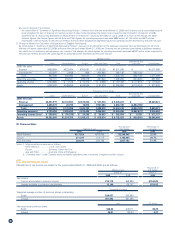
26. Segment Information
(1) Business Segment Information
Business segment information of the Companies for the years ended March 31, 2009 and 2008 is presented as follows:
Business segment Related business segment products
Business Technologies: MFPs, printers and others
Optics: Optical devices, electronics materials and others
Medical and Graphic Imaging: Medical products, graphic imaging products and others
Sensing: Industrial-use and medical-use measuring instruments and others
Other: Others products not categorized in the above segments
Millions of yen
Business
Technologies Optics
Medical and
Graphic Imaging Sensing Other Total
Eliminations and
Corporate Consolidated
2009: Net sales
External ¥623,682 ¥173,416 ¥125,890 ¥8,393 ¥16,459 ¥ 947,843 ¥ – ¥947,843
Intersegment 4,128 1,052 2,419 595 58,860 67,055 (67,055) –
Total 627,810 174,469 128,309 8,989 75,319 1,014,899 (67,055) 947,843
Operating expenses 575,259 161,930 125,226 8,641 72,043 943,100 (51,517) 891,583
Operating income ¥ 52,551 ¥ 12,538 ¥ 3,083 ¥ 348 ¥ 3,276 ¥ 71,798 ¥ (15,538) ¥ 56,260
Assets ¥440,552 ¥156,283 ¥ 89,736 ¥8,125 ¥56,493 ¥ 751,190 ¥166,867 ¥918,058
Depreciation 30,074 28,141 4,335 326 2,341 65,219 4,959 70,179
Impairment losses 150 785 232 – – 1,168 – 1,168
Capital expenditure 23,918 27,591 3,151 306 2,257 57,224 3,939 61,164
Notes:
1. Operating expenses not able to be properly allocated that are included in Eliminations and Corporate are principally R&D expenses incurred by the Company
and expenses associated with head office functions. Such expenses amounted to ¥31,297 million for the year ended March 31, 2009.
2. Included within the Eliminations and Corporate figure for assets are ¥202,373 million of corporate assets, which primarily include the holding company’s
surplus operating funds (cash and short-term investment securities) and long-term investment funds (investment securities) as well as other assets held by
the holding company.
3. Accounting Changes
(1) Accounting standards for measurement of inventories
As noted earlier in “Summary of Significant Accounting Policies”, effective from the year ended March 31, 2009, the Company and its domestic
consolidated subsidiaries adopted ASBJ Statement No. 9, “Accounting Standards for Measurement of Inventories”, issued by the ASBJ on July 5, 2006.
As a result of this adoption, the Business Technologies figures, the Optics figures, the Medical and Graphic Imaging figures, the Sensing figures and the
Other figures for operating expenses increased ¥1,191 million, ¥1,680 million, ¥668 million, ¥39 million and ¥64 million, respectively, when compared to
the previous method. And also these business segment figures for operating income decreased by the same amount.
(2) Loss on disposal of inventories
As noted earlier in “Summary of Significant Accounting Policies”, effective from the year ended March 31, 2009, the Company and its consolidated
subsidiaries recognize the loss on disposal of inventory as cost of sales, following accounting policy review caused by the introduction of adoption of ASBJ
Statement No. 9, “Accounting Standards for Measurement of Inventories”, issued by the ASBJ on July 5, 2006. As a result of this change, the Business
Technologies figures, the Optics figures, the Medical and Graphic Imaging figures, the Sensing figures and the Other figures for operating expenses
increased ¥2,092 million, ¥294 million, ¥185 million, ¥17 million and ¥16 million, respectively, when compared to the previous method. And also these
business segment figures for operating income decreased by the same amount.