Konica Minolta 2003 Annual Report Download - page 8
Download and view the complete annual report
Please find page 8 of the 2003 Konica Minolta annual report below. You can navigate through the pages in the report by either clicking on the pages listed below, or by using the keyword search tool below to find specific information within the annual report.-
 1
1 -
 2
2 -
 3
3 -
 4
4 -
 5
5 -
 6
6 -
 7
7 -
 8
8 -
 9
9 -
 10
10 -
 11
11 -
 12
12 -
 13
13 -
 14
14 -
 15
15 -
 16
16 -
 17
17 -
 18
18 -
 19
19 -
20
-
21
-
22
-
23
-
24
-
25
-
26
-
27
-
28
-
29
-
30
-
31
-
32
-
33
-
34
-
35
-
36
-
37
-
38
-
39
-
40
-
41
-
42
-
43
-
44
-
45
-
46
-
47
-
48
-
49
-
50
-
51
-
52
-
53
-
54
-
55
-
56
 |
 |

KONICA M INOLTA HOLDINGS, INC. 2 0 0 3
Pag e 6
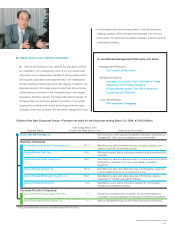
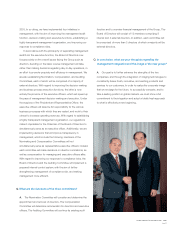
Q. Please describe the expected effects of the integration.
A. In all integrated fields, we are promoting greater efficiency by
revamping our business structures, as well as consolidating and
streamlining organizations. We are also reducing procurement
cost through improved purchasing power, driving sales by
increased marketing efficiency, and in particular reducing
employee numbers by 4,000 across the Group. These measures
will produce annual cost savings of ¥50 billion in fiscal 2005. In the
image information business, the largest business for both Konica
and Minolta, Konica has great strength in the development and
marketing of high-speed multifunctional peripherals (MFPs), while
Minolta has strong developing and marketing ability in medium- to
low-speed MFPs and particularly color MFPs and laser printers
(LBPs), where it maintains a large share of the market. As an
integrated force, the new company will possess an extremely
formidable technical and marketing advantage over many of its
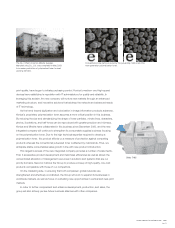
rivals. In addition, the Company is deriving tremendous synergy by
utilizing the advantage of the polymerization toner, another core
business. The combined strengths will result in further dramatic
improvements in competitiveness, while at the same time greatly
increase the impact the Company has on the marketplace, and
increase sales. In addition, referring to the optical technology field
that is another strength of both companies, combining Konica’s
plastic lens technology with Minolta’s glass mold technology, we
will expand our business and further solidify our hold on the top
spots in the optics business. In our microcamera unit business,
where we expect rapid expansion, we aim for sizable business
growth, including building a structure capable of striving for the
top share of the market. In our camera and consumer imaging
business, we aim for increased earning power and greater sales
by building a solid marketing organization for all of our camera and
photosensitive paper product lines.
We will increase sales and earnings through benefits derived
from the integrated product lineups and the strengthened
worldwide marketing network.
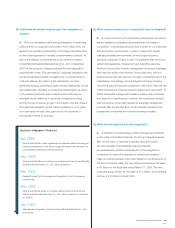
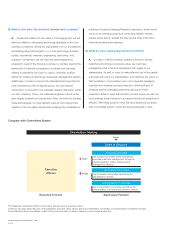
Q. What are the workings of the integration?
A. Konica Corporation migrated to a holding company structure
in April 2003, and Konica Corporation and Minolta Co., Ltd.
concluded management integration in an exchange of shares in
August 2003, with one share of Minolta stock being valued at
0.621 share of Konica stock. With completion of the stock swap,
the name of the integrated company was changed to Konica
Minolta Holdings, Inc. Given that the post-integration management
structure consists of spinning off business operations into
independent companies under the holding company, we opted for
the exchange of shares scheme because it would simplify the
processing involved. While Konica Minolta Holdings, Inc. is built on
the foundation of equality between the two companies, this is in
fact the creation and birth of a new corporate group.
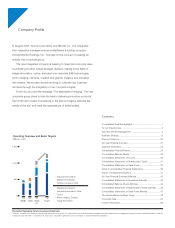
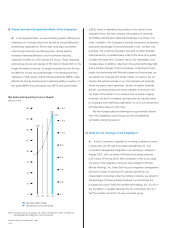
’03
1,087
’04 ’05 ’06
160
Net Sales (Right Scale)
Operating Income (Left Scale)
Net Sales and Operating Income Targets
0
20
40
60
80
100
120
140
0
200
Note: Forecasts are as of January 15, 2003, the date the "Letter of Intent for
the Management Integration" was announced.
400
600
800
1,000
1,200
1,400
150
1,300
77.3
(Billions of yen)