Konica Minolta 2003 Annual Report Download - page 3
Download and view the complete annual report
Please find page 3 of the 2003 Konica Minolta annual report below. You can navigate through the pages in the report by either clicking on the pages listed below, or by using the keyword search tool below to find specific information within the annual report.-
 1
1 -
 2
2 -
 3
3 -
 4
4 -
 5
5 -
 6
6 -
 7
7 -
 8
8 -
 9
9 -
 10
10 -
 11
11 -
 12
12 -
 13
13 -
 14
14 -
15
-
16
-
17
-
18
-
19
-
20
-
21
-
22
-
23
-
24
-
25
-
26
-
27
-
28
-
29
-
30
-
31
-
32
-
33
-
34
-
35
-
36
-
37
-
38
-
39
-
40
-
41
-
42
-
43
-
44
-
45
-
46
-
47
-
48
-
49
-
50
-
51
-
52
-
53
-
54
-
55
-
56
 |
 |

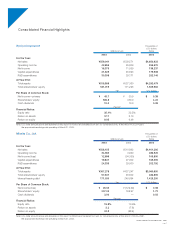
Consolidated Financ ial Highlights
KONIC A MINOLTA HOLDINGS, INC. 2 0 0 3
Pag e 1
Konica Corporation Thousands of
U.S. dollars
Millions of yen (Note)
2003 2002 2003
For the Year:
Net sales ¥559,041 ¥539,571 $4,650,923
Operating income 42,855 29,609 356,531
Net income 16,375 11,059 136,237
Capital expenditures 21,625 45,593 179,908
R&D expenditures 30,308 29,171 252,146
At Year-End:
Total assets ¥515,956 ¥527,360 $4,292,479
Total shareholders’ equity 181,019 171,226 1,505,982
Yen U.S. dollars
Per Share of Common Stock:
Net income—primary ¥ 45.7 ¥ 30.9 $ 0.38
Shareholders’ equity 506.8 479.0 4.22
Cash dividends 10.0 10.0 0.08
Percent
Financial Ratios:
Equity ratio 35.1% 32.5%
Return on assets 3.17 2.10
Return on equity 9.05 6.46
Note: U.S. dollar amounts above and elsewhere in this report for Konica are translated from yen, for convenience only, at the rate of ¥120.20=US$1,
Note: the approximate exchange rate prevailing at March 31, 2003.
Minolta Co., Ltd. Thousands of
U.S. dollars
Millions of yen (Note)
2003 2002 2003
For the Year:
Net sales ¥528,155 ¥510,862 $4,401,292
Operating income 34,383 3,950 286,525
Net income (loss) 12,696 (34,350) 105,800
Capital expenditures 19,847 27,002 165,392
R&D expenditures 24,335 29,000 202,792
At Year-End:
Total assets ¥367,278 ¥427,247 $3,060,650
Total shareholders’ equity 57,947 46,502 482,892
Interest-bearing debt 171,030 240,694 1,425,250
Yen U.S. dollars
Per Share of Common Stock:
Net income (loss) ¥ 45.33 ¥ (122.59) $ 0.38
Shareholders’ equity 207.02 165.97 1.73
Cash dividends 3.00 —0.03
Percent
Financial Ratios:
Equity ratio 15.8% 10.9%
Return on assets 3.2 (7.8)
Return on equity 24.3 (58.4)
Note: U.S. dollar amounts above and elsewhere in this report for Minolta are translated from yen, for convenience only, at the rate of ¥120.00=US$1,
Note: the approximate exchange rate prevailing at March 31, 2003.