Konica Minolta 2003 Annual Report Download - page 44
Download and view the complete annual report
Please find page 44 of the 2003 Konica Minolta annual report below. You can navigate through the pages in the report by either clicking on the pages listed below, or by using the keyword search tool below to find specific information within the annual report.-
 1
1 -
2
-
3
-
4
-
5
-
6
-
7
-
8
-
9
-
10
-
11
-
12
-
13
-
14
-
15
-
16
-
17
-
18
-
19
-
20
-
21
-
22
-
23
-
24
-
25
-
26
-
27
-
28
-
29
-
30
-
31
-
32
-
33
-
 34
34 -
 35
35 -
 36
36 -
 37
37 -
 38
38 -
 39
39 -
 40
40 -
 41
41 -
 42
42 -
 43
43 -
 44
44 -
 45
45 -
 46
46 -
 47
47 -
 48
48 -
 49
49 -
 50
50 -
 51
51 -
 52
52 -
 53
53 -
 54
54 -
55
-
56
 |
 |

KONICA M INOLTA HOLDINGS, INC. 2 0 0 3
Pag e 42
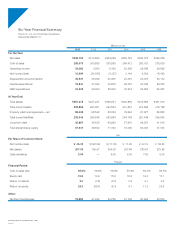
Six-Year Financ ial Sum m ary
Millions of yen
2003 2002 2001 2000 1999 1998
For the Year:
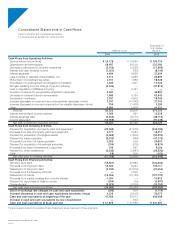
Net sales ¥528,155 ¥510,862 ¥464,289 ¥482,767 ¥506,075 ¥490,259
Cost of sales 293,076 300,585 263,865 269,412 280,021 278,039
Operating income 34,383 3,950 9,190 20,268 29,085 26,892
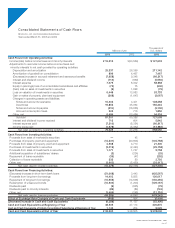
Net income (loss) 12,696 (34,350) (3,127) 3,144 9,002 16,429
Depreciation and amortization 25,337 26,399 25,405 23,387 23,375 20,172
Capital expenditures 19,847 27,002 32,206 26,357 24,046 29,350
R&D expenditures 24,335 29,000 26,300 30,918 26,664 24,267
At Year-End:
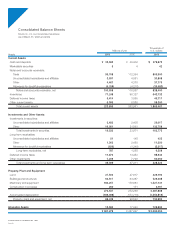
Total assets ¥367,278 ¥427,247 ¥456,251 ¥402,839 ¥415,685 ¥451,614
Total current assets 223,856 263,951 293,524 251,561 274,892 316,188
Property, plant and equipment—net 88,439 98,542 86,339 79,624 81,677 82,652
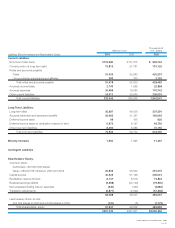
Total current liabilities 233,045 286,548 293,964 244,168 261,444 308,843
Long-term debt 36,887 46,538 60,995 57,910 48,937 41,919
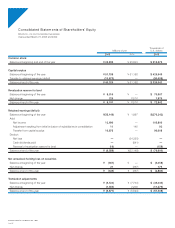
Total shareholders’ equity 57,947 46,502 71,194 75,005 80,047 77,074
Yen
Per Share of Common Stock:
Net income (loss) ¥ 45.33 ¥(122.59) ¥ (11.16) ¥ 11.22 ¥ 32.13 ¥ 58.83
Net assets 207.03 165.97 254.08 267.69 285.67 275.98
Cash dividends 3.00 —6.006.00 7.00 6.00
Percent
Financial Ratios:
Cost of sales ratio 55.5% 58.8% 56.8% 55.8% 55.3% 56.7%
Equity ratio 15.8 10.9 15.6 18.6 19.3 17.1
Return on assets 3.2 (7.8) (0.7) 0.8 2.1 3.9
Return on equity 24.3 (58.4) (4.3) 4.1 11.5 23.6
Other:
Number of employees 19,682 21,932 22,729 21,794 20,294 20,503
Minolta Co., Ltd. and Consolidated Subsidiaries
Years ended March 31