Konica Minolta 2003 Annual Report Download - page 29
Download and view the complete annual report
Please find page 29 of the 2003 Konica Minolta annual report below. You can navigate through the pages in the report by either clicking on the pages listed below, or by using the keyword search tool below to find specific information within the annual report.-
 1
1 -
2
-
3
-
4
-
5
-
6
-
7
-
8
-
9
-
10
-
11
-
12
-
13
-
14
-
15
-
16
-
17
-
18
-
 19
19 -
 20
20 -
 21
21 -
 22
22 -
 23
23 -
 24
24 -
 25
25 -
 26
26 -
 27
27 -
 28
28 -
 29
29 -
 30
30 -
 31
31 -
 32
32 -
 33
33 -
 34
34 -
 35
35 -
 36
36 -
 37
37 -
 38
38 -
 39
39 -
40
-
41
-
42
-
43
-
44
-
45
-
46
-
47
-
48
-
49
-
50
-
51
-
52
-
53
-
54
-
55
-
56
 |
 |

KONICA M INOLTA HOLDINGS, INC. 2 0 0 3
Pag e 27
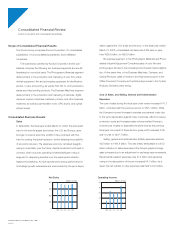
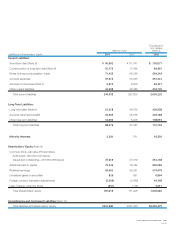
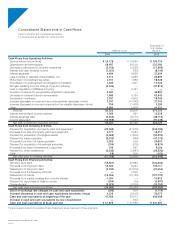
Assets, Liabilities, and Equity
Total assets as of March 31, 2003 totaled ¥516.0 billion, a decline of
¥11.4 billion compared with the previous fiscal year-end. In current
assets, trade notes and accounts receivable declined ¥8.0 billion
and inventory fell ¥3.5 billion. The balance of cash and other current
assets however increased ¥13.7 billion, for an aggregate rise in total
current assets of ¥2.2 billion.
For the fiscal year under review, capital expenditures of ¥21.6
billion fell below depreciation expense of ¥28.5 billion. As a result,
the balance of property, plant and equipment, net, fell ¥8.0 billion.
Investments and other assets declined by ¥5.6 billion for an aggre-
gate fall in fixed assets of ¥13.6 billion. As a result, the balance of
total assets as of the fiscal year-end decreased ¥11.4 billion.
On the liabilities side, current liabilities declined ¥23.8 billion.
Major components were an increase of ¥5.6 billion in reserve for
structural reforms relating to the consumer imaging business and
declines in interest-bearing debt and other current liabilities of ¥28.8
billion and ¥0.6 billion, respectively. Long-term liabilities rose ¥1.1 bil-
lion resulting in an aggregate decline in total liabilities of ¥23.7 billion.
Turning to shareholders’ equity, while consolidated retained
earnings increased by ¥12.8 billion, foreign currency translation and
other losses increased by ¥2.7 billion. As a result, total shareholders’
equity increased ¥9.8 billion compared with the previous fiscal year-
end.
Reducing total assets and increasing shareholders’ equity in this
manner resulted in an increase of 2.6 percentage points in the share-
holders’ equity ratio over the previous fiscal year to 35.1%.
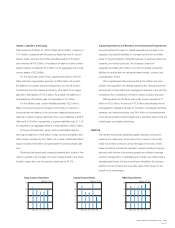
Capital Expenditures and Research and Development Expenditures
Konica invested ¥6.5 billion in capital expenditures primarily in the
upgrade of production facilities for medical-use dry film and inkjet
paper in the photographic materials business. In business machines,
cameras, and optical products, the Company undertook
expenditures totaling ¥6.7 billion in an effort to bolster production
facilities for optical disk non-spherical plastic lenses, copiers, and
polymerization toners.
Other capital expenditures amounted to ¥8.4 billion and were
used for the acquisition of buildings owned by the Company and the
development of information and management systems in line with the
companies move toward spin off and a holding company structure.
R&D expenses for the fiscal year under review increased ¥1.4
billion to ¥30.3 billion. An amount ¥13.8 billion was allocated to the
photographic materials business, ¥11.6 billion to business machines,
cameras, and optical products, and ¥4.9 billion to the development
of the Group’s platform technologies and in particular state-of-the-art
technologies and digital networking.
Outlook
The market trend toward adopting digital networks continues to
advance at a rapid pace. At the same time, however, the world’s
major economies continue to show few signs of recovery. Under
these conditions, Konica has decided to adopt a holding company
structure with the aim of promoting speedy and efficient business
portfolio management. In establishing an entirely new entity under a
strengthened format, Konica is working to strengthen its business
platform and to enhance the corporate value of the Group for the
benefit of its shareholders.
(Billions of Yen)
0
12
24
36
48
’99 ’00 ’01 ’02 ’03
Capital Expenditures
(Billions of Yen)
0
10
20
30
40
’99 ’00 ’01 ’02 ’03
Depreciation Expenses
(Billions of Yen)
0
8
16
24
32
’99 ’00 ’01 ’02 ’03
R&D Expenditures