Konica Minolta 2003 Annual Report Download - page 26
Download and view the complete annual report
Please find page 26 of the 2003 Konica Minolta annual report below. You can navigate through the pages in the report by either clicking on the pages listed below, or by using the keyword search tool below to find specific information within the annual report.-
 1
1 -
2
-
3
-
4
-
5
-
6
-
7
-
8
-
9
-
10
-
11
-
12
-
13
-
14
-
15
-
 16
16 -
 17
17 -
 18
18 -
 19
19 -
 20
20 -
 21
21 -
 22
22 -
 23
23 -
 24
24 -
 25
25 -
 26
26 -
 27
27 -
 28
28 -
 29
29 -
 30
30 -
 31
31 -
 32
32 -
 33
33 -
 34
34 -
 35
35 -
 36
36 -
37
-
38
-
39
-
40
-
41
-
42
-
43
-
44
-
45
-
46
-
47
-
48
-
49
-
50
-
51
-
52
-
53
-
54
-
55
-
56
 |
 |

KONICA M INOLTA HOLDINGS, INC. 2 0 0 3
Pag e 24
Consolidated Financ ial Review
Scope of Consolidated Financial Results
The Konica Group comprises Konica Corporation, 75 consolidated
subsidiaries, 18 unconsolidated subsidiaries, and 9 affiliated
companies.
The businesses operated by Konica Corporation and its sub-
sidiaries comprise the following two business segments and are dif-
ferentiated on a product basis. The Photographic Materials segment
deals primarily in the production and marketing of color film, paper,
minilab equipment, film and processing equipment for identification
photos, x-rays, and printing, as well as TAC film for LCD polarization
plates and inkjet printing products. The Business Machines segment
deals primarily in the production and marketing of cameras, digital
cameras, copiers, facsimiles machines, printers, and other business
machines, as well as polymerization toner, OPC drums, and optical
pickup lenses.
Consolidated Business Results
Sales
In fiscal 2002, the fiscal year ended March 31, 2003, the downward
trend in the world’s largest economies, the U.S. and Europe, grew
stronger. Concerns about the conflict in Iraq combined with this
trend to prolong the global recession, further delaying the possibility
of economic recovery. The Japanese economy remained sluggish,
owing to uncertainty over the future. Capital investment continued to
contract, while consumer spending remained lackluster owing in
large part to deepening anxieties over the employment situation.
Against this backdrop, Konica experienced a strong performance in
its strategic growth businesses and was boosted by the yen’s depre-
ciation against the U.S. dollar and the euro. In the fiscal year ended
March 31, 2003, consolidated net sales rose 3.6% year on year,
from ¥539.6 billion, to ¥559.0 billion.
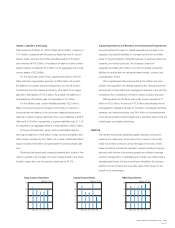
By business segment, in the Photographic Materials and Photo-
related Industrial Equipment Companies sales of color film and
printing paper fell due to the increasing trend toward market digitiza-
tion. At the same time, in the Business Machines, Cameras, and
Optical Products, sales of medium- and high-speed copiers in the
Office Document Company and optical pickup lenses in the Optical
Products Company were strong.
Cost of Sales, and Selling, General and Administrative
Expenses
The cost of sales during the fiscal year under review increased ¥11.7
billion, compared with the previous period, to ¥321.4 billion. While
the Company incurred increased overseas procurement costs due
to the yen’s depreciation against major currencies, efforts to reduce
production costs and increased sales volume enabled Konica to
hold the cost of sales to essentially the same level as the previous
fiscal year. As a result of these factors, gross profit increased 3.4%
year on year to ¥237.7 billion.
Selling, general and administrative (SG&A) expenses declined
¥5.5 billion to ¥194.8 billion. This was mainly attributable to a ¥3.5
billion reduction in sales expenses at the Group’s graphics image
sales company due to an adjustment for exchange rate movements.
Experimental research expenses rose ¥1.4 billion and expenses
owing to the depreciation of the yen increased ¥4.1 billion. As a
result, the net cutback in other expenses was held to ¥2.0 billion.
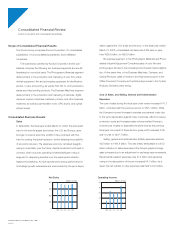
(Billions of Yen)
0
150
300
450
600
’99 ’00 ’01 ’02 ’03
Net Sales
(Billions of Yen)
0
10
20
30
40
50
’99 ’00 ’01 ’02 ’03
Operating Income
Konica Corporation and Consolidated Subsidiaries