Konica Minolta 2003 Annual Report Download - page 42
Download and view the complete annual report
Please find page 42 of the 2003 Konica Minolta annual report below. You can navigate through the pages in the report by either clicking on the pages listed below, or by using the keyword search tool below to find specific information within the annual report.-
 1
1 -
2
-
3
-
4
-
5
-
6
-
7
-
8
-
9
-
10
-
11
-
12
-
13
-
14
-
15
-
16
-
17
-
18
-
19
-
20
-
21
-
22
-
23
-
24
-
25
-
26
-
27
-
28
-
29
-
30
-
31
-
 32
32 -
 33
33 -
 34
34 -
 35
35 -
 36
36 -
 37
37 -
 38
38 -
 39
39 -
 40
40 -
 41
41 -
 42
42 -
 43
43 -
 44
44 -
 45
45 -
 46
46 -
 47
47 -
 48
48 -
 49
49 -
 50
50 -
 51
51 -
 52
52 -
53
-
54
-
55
-
56
 |
 |

KONICA M INOLTA HOLDINGS, INC. 2 0 0 3
Pag e 40
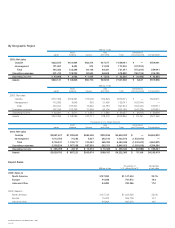
By Geographic Region
Millions of yen
North Asia Eliminations
Japan America Europe and Other Total and Corporate Consolidation
2003: Net sales
Outside ¥323,524 ¥124,964 ¥83,474 ¥27,077 ¥ 559,041 ¥ — ¥559,041
Intersegment 121,857 8,424 674 41,243 172,200 (172,200)
Total 445,382 133,388 84,148 68,321 731,241 (172,200) 559,041
Operating expenses 401,412 128,325 82,644 66,508 678,890 (162,705) 516,185
Operating income ¥ 43,969 ¥ 5,063 ¥ 1,504 ¥ 1,813 ¥ 52,350 ¥ (9,495) ¥ 42,855
Assets ¥340,141 ¥ 83,806 ¥60,770 ¥22,810 ¥ 507,528 ¥ 8,427 ¥515,956
Millions of yen
North Asia Eliminations
Japan America Europe and Other Total and Corporate Consolidation
2002: Net sales
Outside ¥317,306 ¥126,361 ¥73,009 ¥22,894 ¥539,571 ¥ — ¥539,571
Intersegment 112,985 6,945 620 31,489 152,041 (152,041) —
Total 430,291 133,307 73,629 54,384 691,613 (152,041) 539,571
Operating expenses 397,599 129,796 71,686 53,104 652,186 (142,224) 509,961
Operating income ¥ 32,691 ¥ 3,511 ¥ 1,943 ¥ 1,280 ¥ 39,427 ¥ (9,817) ¥ 29,609
Assets ¥343,399 ¥ 98,286 ¥43,771 ¥18,412 ¥503,869 ¥ 23,491 ¥527,360
Thousands of U.S. dollars (Note 3)
North Asia Eliminations
Japan America Europe and Other Total and Corporate Consolidation
2003: Net sales
Outside $2,691,547 $1,039,634 $694,459 $225,266 $4,650,923 $ — $4,650,923
Intersegment 1,013,785 70,083 5,607 343,120 1,432,612 (1,432,612) —
Total 3,705,341 1,109,717 700,067 568,394 6,083,536 (1,432,612) 4,650,923
Operating expenses 3,339,534 1,067,596 687,554 553,311 5,648,003 (1,353,619) 4,294,384
Operating income $ 365,799 $ 42,121 $ 12,512 $ 15,083 $ 435,524 $ (78,993) $ 356,531
Assets $2,829,792 $ 697,221 $505,574 $189,767 $4,222,363 $ 70,108 $4,292,479
Export Sales
Thousands of Percentage
Millions of yen U.S. dollars (Note 3) of net sales
2003: Sales to
North America ¥137,930 $1,147,504 24.7%
Europe 91,589 761,972 16.4
Asia and Other 94,990 790,266 17.0
2002: Sales to
North America ¥137,723 $1,033,956 25.5%
Europe 79,352 595,736 14.7
Asia and Other 88,668 665,676 16.5