Konica Minolta 2003 Annual Report Download - page 28
Download and view the complete annual report
Please find page 28 of the 2003 Konica Minolta annual report below. You can navigate through the pages in the report by either clicking on the pages listed below, or by using the keyword search tool below to find specific information within the annual report.-
 1
1 -
2
-
3
-
4
-
5
-
6
-
7
-
8
-
9
-
10
-
11
-
12
-
13
-
14
-
15
-
16
-
17
-
 18
18 -
 19
19 -
 20
20 -
 21
21 -
 22
22 -
 23
23 -
 24
24 -
 25
25 -
 26
26 -
 27
27 -
 28
28 -
 29
29 -
 30
30 -
 31
31 -
 32
32 -
 33
33 -
 34
34 -
 35
35 -
 36
36 -
 37
37 -
 38
38 -
39
-
40
-
41
-
42
-
43
-
44
-
45
-
46
-
47
-
48
-
49
-
50
-
51
-
52
-
53
-
54
-
55
-
56
 |
 |
KONICA M INOLTA HOLDINGS, INC. 2 0 0 3
Pag e 26
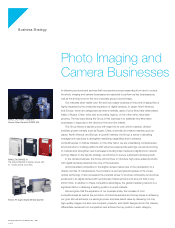
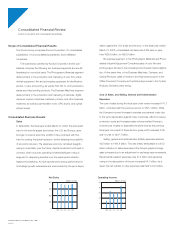
Business Machines
Sales in the Business Machines segment rose 10.7% to ¥264.7
billion. Operating income rose 68.4% over the previous fiscal year to
¥36.5 billion.
The Office Document business, which accounts for the leading
share of this business, posted record sales of ¥204.6 billion, boosted
by the shift in copier sales toward value-added products such as
medium- and high-speed multifunctional peripherals (MFPs) and
strong sales of the next-generation polymerization toners. Operating
income in this business surged to ¥22.4 billion.
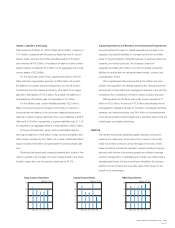
The optical pickup lens business of the Optics Technology busi-
ness experienced rapid growth in the first half of the fiscal year under
review due to increasing popularity of DVD players and increased
demand for software. The sharp jump in demand in China and Hong
Kong for video CD players also impacted favorably on results. While
inventory adjustments in the second half reduced unit volume
shipped, total shipments for fiscal 2002 increased by 47% com-
pared with the previous fiscal year. In terms of product composition,
DVD recorders, which have comparatively high unit prices, experi-
enced solid sales volume growth.
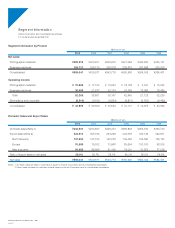
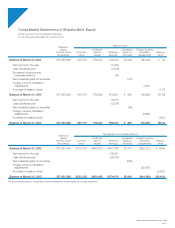
Liquidity and Sources of Capital
The Konica Group has continued to work to increase free cash flow
through increased sales and higher profits. As a result free cash
flows (net cash provided by operating activities minus net cash used
in investing activities) totaled ¥29.1 billion. In the fiscal year under
review Konica reduced interest-bearing debt by ¥24.0 billion to
¥152.1 billion. The debt/equity ratio declined to 0.84 of a point from
1.03 times in the previous fiscal year.
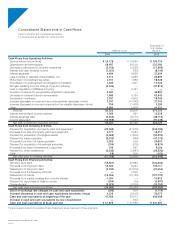
Cash Flows
Net cash provided by operating activities increased ¥18.3 billion to
¥66.4 billion. Income before taxes and minority interests increased
¥9.7 billion to ¥24.7 billion in line with the increase in sales.
Depreciation and amortization expenses increased ¥2.3 billion to
¥28.5 billion, attributed to the start up of operations at the medical
imaging dry film plant in Kofu and the No. 2 line of the TAC film plant
for LCD polarizing plates in Kobe, completed in fiscal 2001.
Accounts receivable fell ¥7.7 billion while inventory declined ¥2.2
billion. Accounts payable increased ¥3.3 billion and operating capital
rose ¥13.2 billion.
Net cash used in investing activities narrowed ¥2.2 billion to
¥37.3 billion. The principal components were mainly related to
investments in the Company’s medical-use dry film production facili-
ties, TAC film for LCD polarization plates, and the acquisition of
property, plant and equipment to strengthen production facilities for
polymerization toner totaling ¥29.5 billion, down ¥12.1 billion from
the previous fiscal year.
Moreover, Konica utilized ¥9.4 billion in investing activities for the
acquisition of intangible fixed assets and an increase in loans
receivable.
Net cash used in financing activities amounted to ¥24.7 billion,
up ¥5.6 billion from the previous fiscal year. This was mainly attribut-
able to the repayment of long-term loans from financial institutions
and the redemption of bonds. As a result, interest-bearing debt
stood at ¥152.1 billion, a decline of ¥24.0 billion from the end of the
previous fiscal year.
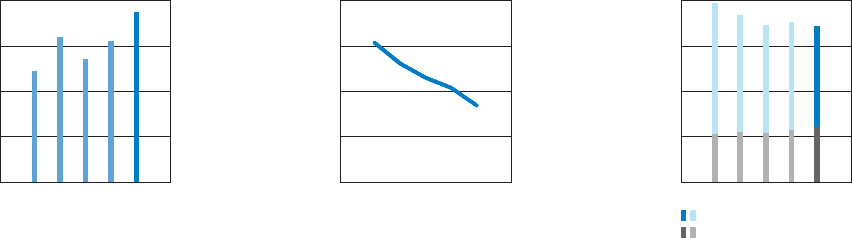
(times)
0
0.5
1
1.5
2
’99 ’00 ’01 ’02 ’03
Debt/Equity Ratio
(Billions of Yen)
0
12
24
36
48
’99 ’00 ’01 ’02 ’03
Gross Cash Flow
(Billions of Yen)
Total Assets
Shareholders’ Equity
0
150
300
450
600
’99 ’00 ’01 ’02 ’03
Total Assets/Shareholders’ Equity