Konica Minolta 2003 Annual Report Download - page 27
Download and view the complete annual report
Please find page 27 of the 2003 Konica Minolta annual report below. You can navigate through the pages in the report by either clicking on the pages listed below, or by using the keyword search tool below to find specific information within the annual report.-
 1
1 -
2
-
3
-
4
-
5
-
6
-
7
-
8
-
9
-
10
-
11
-
12
-
13
-
14
-
15
-
16
-
 17
17 -
 18
18 -
 19
19 -
 20
20 -
 21
21 -
 22
22 -
 23
23 -
 24
24 -
 25
25 -
 26
26 -
 27
27 -
 28
28 -
 29
29 -
 30
30 -
 31
31 -
 32
32 -
 33
33 -
 34
34 -
 35
35 -
 36
36 -
 37
37 -
38
-
39
-
40
-
41
-
42
-
43
-
44
-
45
-
46
-
47
-
48
-
49
-
50
-
51
-
52
-
53
-
54
-
55
-
56
 |
 |

KONICA M INOLTA HOLDINGS, INC. 2 0 0 3
Pag e 25
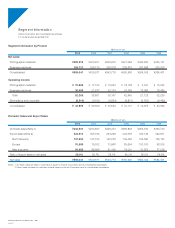
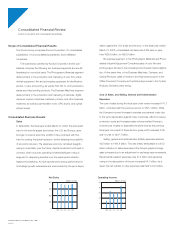
SG&A expenses as a ratio to net sales fell from 37.1% to 34.8%.
Operating Income, Net Income
Operating income increased 44.7% to ¥42.9 billion, reflecting the
increase in gross profit and measures implemented to reduce
expenses. As a percentage of net sales, operating income improved
from 5.5% in the fiscal year ended March 31, 2002, to 7.7%.
Net other expenses totaled ¥18.1 billion, an increase of ¥3.5
billion, impacted by a number of factors. Although the Company
recorded a foreign exchange gain on overseas sales of ¥2.9 billion in
fiscal 2001 due to the depreciation of the yen, Konica incurred an
exchange loss of ¥2.4 billion, a turnaround of ¥5.3 billion, in the fiscal
year under review due to the yen’s appreciation. The Company also
recorded income of ¥4.5 billion from the transfer to a defined con-
tributory pension system. This however was offset by business
restructuring expenses of ¥5.6 billion in preparation for structural
reform of its consumer imaging business. Other income for fiscal
2002 totaled ¥2.9 billion.
As a result of the preceding factors, income before income taxes
and minority interests increased 64.9% compared with the previous
fiscal year to ¥24.7 billion, and net income increased 48.1% to ¥16.4
billion, a record profit for the Group. Earnings per share of common
stock jumped from ¥30.9 to ¥45.7, return on equity increased from
6.46% to 9.05%, and return on assets rose from 2.10% to 3.17%.
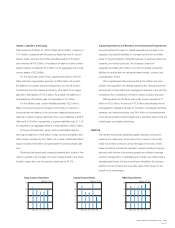
Segment Information
Photographic Materials
Sales in our Photographic Materials segment declined 2.0% com-
pared with the previous fiscal year to ¥294.3 billion. Operating
income in this segment declined 7.3% year on year to ¥15.9 billion.
In the Color Film and Printing Paper fields, sales increased in the
growth markets of Russia and Asia. In mature markets such as
Japan, Europe, and the U.S., however, sales contracted due to the
increased penetration of digital cameras and the impact on tradi-
tional silver-halide film and a decline in product prices. Operating
income in this segment increased year on year due to cutbacks in
production and fixed expenses.
In the Medical and Graphic Imaging business, the trend toward
digital networks continues to increase rapidly. In the midst of these
circumstances, the dry film products of the Company’s medical
imaging business performed steadily. In the graphic imaging busi-
ness, overseas sales of printer film and domestic sales of digital
color proof-related equipment were strong despite market contrac-
tion brought on by the trend to CTP processing. On the earnings
front, operating income in the medical and graphic imaging business
declined year on year significantly impacted by depreciation
expenses following start up of the Company’s Kofu dry film plant.
Sales of tri-acetyl cellulose (TAC) film for use in LCD polarization
plates, designated a strategic business, increased substantially.
Amortization of the No. 2 line at Konica’s Kobe facility, which went
online in August 2002, however, offset contributions to earnings in
the photographic materials business.
(%)
–4
0
4
8
12
’99 ’00 ’01 ’02 ’03
Return on Equity
(Billions of Yen)
–6
0
6
12
18
’99 ’00 ’01 ’02 ’03
Net Income
(Yen)
–16
0
16
32
48
’99 ’00 ’01 ’02 ’03
Net Income per Share