Konica Minolta 2003 Annual Report Download - page 34
Download and view the complete annual report
Please find page 34 of the 2003 Konica Minolta annual report below. You can navigate through the pages in the report by either clicking on the pages listed below, or by using the keyword search tool below to find specific information within the annual report.-
 1
1 -
2
-
3
-
4
-
5
-
6
-
7
-
8
-
9
-
10
-
11
-
12
-
13
-
14
-
15
-
16
-
17
-
18
-
19
-
20
-
21
-
22
-
23
-
 24
24 -
 25
25 -
 26
26 -
 27
27 -
 28
28 -
 29
29 -
 30
30 -
 31
31 -
 32
32 -
 33
33 -
 34
34 -
 35
35 -
 36
36 -
 37
37 -
 38
38 -
 39
39 -
 40
40 -
 41
41 -
 42
42 -
 43
43 -
 44
44 -
45
-
46
-
47
-
48
-
49
-
50
-
51
-
52
-
53
-
54
-
55
-
56
 |
 |

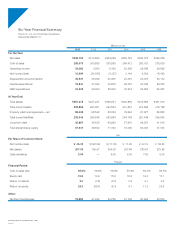
KONICA M INOLTA HOLDINGS, INC. 2 0 0 3
Pag e 32
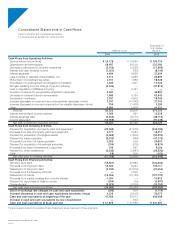
Consolidated Statem ents of Cash Flow s
Konica Corporation and Consolidated Subsidiaries
For the fiscal years ended March 31, 2003 and 2002
Thousands of
U.S. dollars
Millions of yen (Note 3)
2003 2002 2003
Cash Flows from Operating Activities:
Income before income taxes ¥24,728 ¥14,994 $205,724
Depreciation and amortization 28,497 26,219 237,080
Decrease in allowance for doubtful receivables (2,163) (2,055) (17,995)
Interest and cash dividend income (1,051) (720) (8,744)
Interest expenses 4,484 6,668 37,304
Loss on sales or disposal of fixed assets, net 3,112 4,088 25,890
Write-down of investment securities 2,167 1,688 18,028
Amortization of unrecognized net obligation at transition 1,325 1,647 11,023
Net gain resulting from the change of pension scheme (4,544) —(37,812)
Loss on liquidation of affiliated company —2,451 —
Provision of reserve for reorganization/liquidation expenses 5,637 —46,897
Decrease in notes and accounts receivable 7,686 9,164 63,943
Decrease in inventories 2,187 4,202 18,195
Increase (decrease) in notes and accounts payables (decrease: minus) 3,337 (13,349) 27,762
Increase (decrease) in accrued consumption tax payable (decrease: minus) 155 (1,405) 1,290
Other 4,991 5,609 41,522
Subtotal 80,552 59,205 670,150
Interest and dividend income received 1,506 697 12,529
Interest expenses paid (4,653) (6,773) (38,710)
Income taxes paid (10,968) (5,003) (91,248)
Net cash provided by operating activities 66,437 48,125 552,720
Cash Flows from Investing Activities:
Payment for acquisition of property, plant and equipment (29,545) (41,616) (245,799)
Proceeds from sale of property, plant and equipment 2,177 5,483 18,111
Payment for acquisition of intangible assets (3,669) (1,500) (30,524)
Payment for loans receivable (5,743) (449) (47,779)
Proceeds from return of loans receivable 2,963 939 24,651
Payment for acquisition of investment securities (706) (216) (5,874)
Proceeds from sales of investment in securities 746 697 6,206
Payment for other investments (3,533) (3,641) (29,393)
Other (18) 806 (150)
Net cash used in investing activities (37,328) (39,496) (310,549)
Cash Flows from Financing Activities:
Net short-term debt (19,551) 22,986 (162,654)
Proceeds from long-term debt 16,000 8,223 133,111
Redemption of long-term debt (3,300) (33,512) (27,454)
Proceeds from the issuance of bonds —2,000 —
Redemption of bonds (15,354) (15,150) (127,737)
Proceeds from capital increase from minority interest 1,300 —10,815
Payment for repurchase of treasury stocks (204) (19) (1,697)
Dividends paid (3,576) (3,576) (29,750)
Net cash used in financing activities (24,685) (19,049) (205,366)
Effect of exchange rate changes on cash and cash equivalents (206) 904 (1,714)
Increase (decrease) in cash and cash equivalents (decrease: minus) 4,216 (9,515) 35,075
Cash and cash equivalents at beginning of the year 47,659 56,573 396,498
Increase in cash and cash equivalents by new consolidation — 602 —
Cash and cash equivalents at fiscal year-end ¥ 51,876 ¥47,659 $431,581
The accompanying Notes to Consolidated Financial Statements are an integral part of these statements.