Konica Minolta 2003 Annual Report Download - page 49
Download and view the complete annual report
Please find page 49 of the 2003 Konica Minolta annual report below. You can navigate through the pages in the report by either clicking on the pages listed below, or by using the keyword search tool below to find specific information within the annual report.-
 1
1 -
2
-
3
-
4
-
5
-
6
-
7
-
8
-
9
-
10
-
11
-
12
-
13
-
14
-
15
-
16
-
17
-
18
-
19
-
20
-
21
-
22
-
23
-
24
-
25
-
26
-
27
-
28
-
29
-
30
-
31
-
32
-
33
-
34
-
35
-
36
-
37
-
38
-
 39
39 -
 40
40 -
 41
41 -
 42
42 -
 43
43 -
 44
44 -
 45
45 -
 46
46 -
 47
47 -
 48
48 -
 49
49 -
 50
50 -
 51
51 -
 52
52 -
 53
53 -
 54
54 -
 55
55 -
 56
56
 |
 |

KONICA M INOLTA HOLDINGS, INC. 2 0 0 3
Pag e 47
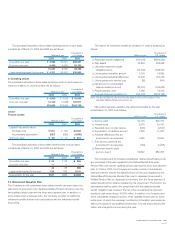
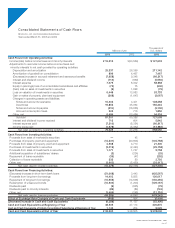
Consolidated Statem ents of Cash Flow s
Minolta Co., Ltd. and Consolidated Subsidiaries
Years ended March 31, 2003 and 2002
Thousands of
Millions of yen U.S. dollars
2003 2002 2003
Cash Flows from Operating Activities:
Income (loss) before income taxes and minority interests ¥ 15,316 ¥(33,569) $ 127,633
Adjustments to reconcile income before income taxes and
minority interests to net cash provided by operating activities:
Depreciation and amortization 25,337 26,399 211,142
Amortization of goodwill on consolidation 896 4,467 7,467
(Decrease) increase in accrued retirement and severance benefits (7,958) 9,348 (66,317)
Interest and dividend income (714) (669) (5,950)
Interest expense 7,075 8,302 58,958
Equity in (earnings) loss of unconsolidated subsidiaries and affiliates (72) 75 (600)
(Gain) loss on sales of investments in securities (9) 1,628 (75)
Loss on valuation of investments in securities 6,448 13,983 53,733
Gain on sales of property, plant and equipment (368) (1,647) (3,067)
Changes in operating assets and liabilities:
Notes and accounts receivable 15,403 3,431 128,358
Inventories 19,853 45,064 165,442
Notes and accounts payable (612) (16,656) (5,100)
Accrued consumption taxes 222 716 1,850
Other, net 6,484 (10,484) 54,034
Subtotal 87,301 50,388 727,508
Interest and dividend income received 713 604 5,942
Interest expense paid (7,310) (8,354) (60,917)
Income taxes paid (1,678) (5,362) (13,983)
Net cash provided by operating activities 79,026 37,276 658,550
Cash Flows from Investing Activities:
Proceeds from sales of marketable securities —45 —
Purchases of property, plant and equipment (12,331) (20,804) (102,758)
Proceeds from sales of property, plant and equipment 2,568 4,710 21,400
Purchases of investments in securities (3,019) (2,423) (25,158)
Proceeds from sales of investments in securities 1,171 1,747 9,758
Additional acquisition of subsidiaries’ shares (3) (234) (25)
Repayment of loans receivable (35) (47) (292)
Collection of loans receivable 335 80 2,792
Other, net (3,962) (5,450) (33,017)
Net cash used in investing activities (15,276) (22,376) (127,300)
Cash Flows from Financing Activities:
(Decrease) increase in short-term bank loans (51,068) 3,443 (425,567)
Proceeds from long-term borrowings 14,402 8,925 120,017
Repayment of long-term borrowings (15,659) (14,638) (130,492)
Redemption of unsecured bonds (15,500) (1,200) (129,167)
Dividends paid (9) (845) (75)
Dividends paid to minority interests (89) (84) (742)
Other, net (1,466) (248) (12,216)
Net cash used in financing activities (69,389) (4,647) (578,242)
Effect of Exchange Rate Changes on Cash and Cash Equivalents (649) 884 (5,408)
(Decrease) increase in Cash and Cash Equivalents (6,288) 11,137 (52,400)
Cash and Cash Equivalents at Beginning of Year 38,505 27,114 320,875
Cash and Cash Equivalents of Initially Consolidated Subsidiaries at Beginning of Year
1,143 254 9,525
Cash and Cash Equivalents at End of Year ¥ 33,360 ¥ 38,505 $ 278,000