Intel 2010 Annual Report Download - page 98
Download and view the complete annual report
Please find page 98 of the 2010 Intel annual report below. You can navigate through the pages in the report by either clicking on the pages listed below, or by using the keyword search tool below to find specific information within the annual report.-
 1
1 -
2
-
3
-
4
-
5
-
6
-
7
-
8
-
9
-
10
-
11
-
12
-
13
-
14
-
15
-
16
-
17
-
18
-
19
-
20
-
21
-
22
-
23
-
24
-
25
-
26
-
27
-
28
-
29
-
30
-
31
-
32
-
33
-
34
-
35
-
36
-
37
-
38
-
39
-
40
-
41
-
42
-
43
-
44
-
45
-
46
-
47
-
48
-
49
-
50
-
51
-
52
-
53
-
54
-
55
-
56
-
57
-
58
-
59
-
60
-
61
-
62
-
63
-
64
-
65
-
66
-
67
-
68
-
69
-
70
-
71
-
72
-
73
-
74
-
75
-
76
-
77
-
78
-
79
-
80
-
81
-
82
-
83
-
84
-
85
-
86
-
87
-
 88
88 -
 89
89 -
 90
90 -
 91
91 -
 92
92 -
 93
93 -
 94
94 -
 95
95 -
 96
96 -
 97
97 -
 98
98 -
 99
99 -
 100
100 -
 101
101 -
 102
102 -
 103
103 -
 104
104 -
 105
105 -
 106
106 -
 107
107 -
 108
108 -
109
-
110
-
111
-
112
-
113
-
114
-
115
-
116
-
117
-
118
-
119
-
120
-
121
-
122
-
123
-
124
-
125
-
126
-
127
-
128
-
129
-
130
-
131
-
132
-
133
-
134
-
135
-
136
-
137
-
138
-
139
-
140
-
141
-
142
-
143
-
144
-
145
-
146
-
147
-
148
-
149
-
150
-
151
-
152
-
153
-
154
-
155
-
156
-
157
-
158
-
159
-
160
 |
 |

Table of Contents
INTEL CORPORATION
NOTES TO CONSOLIDATED FINANCIAL STATEMENTS (Continued)
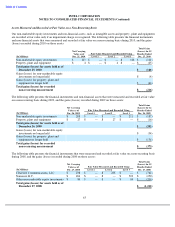
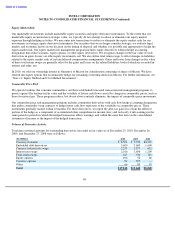
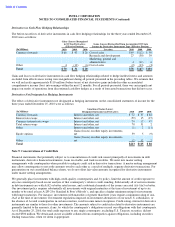
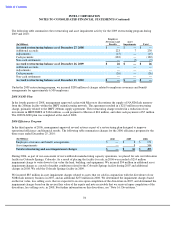
Derivatives in Cash Flow Hedging Relationships
The before-tax effects of derivative instruments in cash flow hedging relationships for the three years ended December 25,
2010 were as follows:
Gains and losses on derivative instruments in cash flow hedging relationships related to hedge ineffectiveness and amounts
excluded from effectiveness testing were insignificant during all periods presented in the preceding tables. We estimate that
we will reclassify approximately $110 million (before taxes) of net derivative gains included in other accumulated
comprehensive income (loss) into earnings within the next 12 months. For all periods presented, there was an insignificant
impact on results of operations from discontinued cash flow hedges as a result of forecasted transactions that did not occur.
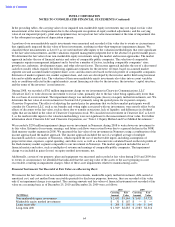
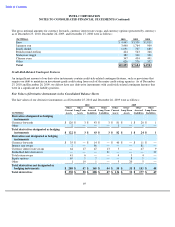
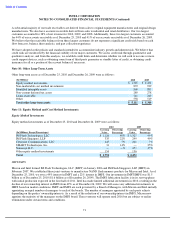
Derivatives Not Designated as Hedging Instruments
The effects of derivative instruments not designated as hedging instruments on the consolidated statements of income for the
three years ended December 25, 2010 were as follows:
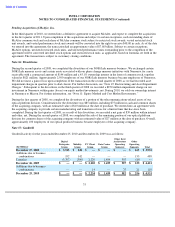
Note 9: Concentrations of Credit Risk
Financial instruments that potentially subject us to concentrations of credit risk consist principally of investments in debt
instruments, derivative financial instruments, loans receivable, and trade receivables. We enter into master netting
arrangements with counterparties when possible to mitigate credit risk in derivative transactions. A master netting arrangement
may allow counterparties to net settle amounts owed to each other as a result of multiple, separate derivative transactions. For
presentation on our consolidated balance sheets, we do not offset fair value amounts recognized for derivative instruments
under master netting arrangements.
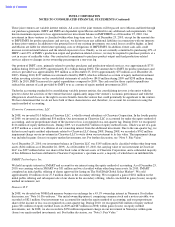
We generally place investments with high-credit-quality counterparties and, by policy, limit the amount of credit exposure to
any one counterparty based on our analysis of that counterparty’s relative credit standing. Substantially all of our investments
in debt instruments are with A/A2 or better rated issuers, and a substantial majority of the issuers are rated AA-/Aa3 or better.
Our investment policy requires substantially all investments with original maturities at the time of investment of up to six
months to be rated at least A-2/P-2 by Standard & Poor’s/Moody’s, and specifies a higher minimum rating for investments
with longer maturities. For instance, investments with maturities of greater than three years require a minimum rating of AA-
/Aa3 at the time of investment. Government regulations imposed on investment alternatives of our non-U.S. subsidiaries, or
the absence of A rated counterparties in certain countries, result in some minor exceptions. Credit-rating criteria for derivative
instruments are similar to those for other investments. The amounts subject to credit risk related to derivative instruments are
generally limited to the amounts, if any, by which the counterparty’
s obligations exceed our obligations with that counterparty.
As of December 25, 2010, the total credit exposure to any single counterparty, excluding U.S. Treasury securities, did not
exceed $500 million. We obtain and secure available collateral from counterparties against obligations, including securities
lending transactions, when we deem it appropriate.
Gains (Losses) Recognized
in OCI on Derivatives
Gains (Losses) Reclassified from Accumulated OCI into
(Effective Portion)
Income by Derivative Instrument Type (Effective Portion)
(In Millions)
2010
2009
2008
Location
2010
2009
2008
Currency forwards
$
66
$
43
$
26
Cost of sales
$
49
$
(12
)
$
59
Research and development
27
(30
)
39
Marketing, general and
administrative
4
(12
)
6
Other
4
(12
)
(6
)
Cost of sales
(2
)
(13
)
(3
)
Total
$
70
$
31
$
20
$
78
$
(67
)
$
101
Location of Gains (Losses)
(In Millions)
Recognized in Income on Derivatives
2010
2009
2008
Currency forwards
Interest and other, net
$
72
$
37
$
82
Interest rate swaps
Interest and other, net
(59
)
15
(27
)
Currency interest rate swaps
Interest and other, net
74
(7
)
47
Total return swaps
Interest and other, net
70
51
2
Other
Interest and other, net
(1
)
2
(11
)
Equity options
Gains (losses) on other equity investments,
net
59
5
(9
)
Other
Gains (losses) on other equity investments,
net
(2
)
12
2
Total
$
213
$
115
$
86