Intel 2010 Annual Report Download - page 55
Download and view the complete annual report
Please find page 55 of the 2010 Intel annual report below. You can navigate through the pages in the report by either clicking on the pages listed below, or by using the keyword search tool below to find specific information within the annual report.-
 1
1 -
2
-
3
-
4
-
5
-
6
-
7
-
8
-
9
-
10
-
11
-
12
-
13
-
14
-
15
-
16
-
17
-
18
-
19
-
20
-
21
-
22
-
23
-
24
-
25
-
26
-
27
-
28
-
29
-
30
-
31
-
32
-
33
-
34
-
35
-
36
-
37
-
38
-
39
-
40
-
41
-
42
-
43
-
44
-
 45
45 -
 46
46 -
 47
47 -
 48
48 -
 49
49 -
 50
50 -
 51
51 -
 52
52 -
 53
53 -
 54
54 -
 55
55 -
 56
56 -
 57
57 -
 58
58 -
 59
59 -
 60
60 -
 61
61 -
 62
62 -
 63
63 -
 64
64 -
 65
65 -
66
-
67
-
68
-
69
-
70
-
71
-
72
-
73
-
74
-
75
-
76
-
77
-
78
-
79
-
80
-
81
-
82
-
83
-
84
-
85
-
86
-
87
-
88
-
89
-
90
-
91
-
92
-
93
-
94
-
95
-
96
-
97
-
98
-
99
-
100
-
101
-
102
-
103
-
104
-
105
-
106
-
107
-
108
-
109
-
110
-
111
-
112
-
113
-
114
-
115
-
116
-
117
-
118
-
119
-
120
-
121
-
122
-
123
-
124
-
125
-
126
-
127
-
128
-
129
-
130
-
131
-
132
-
133
-
134
-
135
-
136
-
137
-
138
-
139
-
140
-
141
-
142
-
143
-
144
-
145
-
146
-
147
-
148
-
149
-
150
-
151
-
152
-
153
-
154
-
155
-
156
-
157
-
158
-
159
-
160
 |
 |

Table of Contents
MANAGEMENT’S DISCUSSION AND ANALYSIS OF FINANCIAL CONDITION AND RESULTS OF
OPERATIONS (Continued)
Impairment charges in 2008 included a $762 million impairment charge recognized on our investment in Clearwire LLC and a
$250 million impairment charge recognized on our investment in Numonyx. We recognized the impairment charge on our
investment in Clearwire LLC to write down our investment to its fair value, primarily due to the fair value being significantly
lower than the cost basis of our investment in the fourth quarter of 2008. The impairment charge on our investment in
Numonyx was due to a general decline in 2008 in the NOR flash memory market segment. See
“Note 11: Equity Method and
Cost Method Investments” in Part II, Item 8 of this Form 10-K.
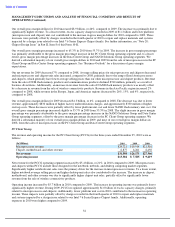
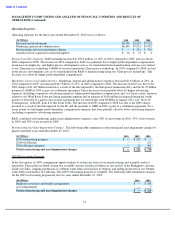
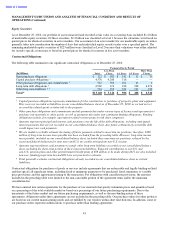
Gains (Losses) on Other Equity Investments, Net
Gains (losses) on other equity investments, net were as follows:
We recognized higher gains on third-party merger transactions, primarily related to our cost method investments; higher gains
on sales; and lower impairment charges in 2010 compared to 2009. Gains on other equity investments in 2010 included a gain
of $67 million on the sale of shares in Micron, which occurred in the first quarter of 2010.
Impairment charges in 2008 included a $176 million impairment charge recognized on our investment in Clearwire
Corporation and $97 million of impairment charges on our investment in Micron. The impairment charge on our investment in
Clearwire Corporation was due to the fair value being significantly lower than the cost basis of our investment at the end of
the fourth quarter of 2008. The impairment charges on our investment in Micron reflected the difference between our cost
basis and the fair value of our investment in Micron at the end of the second and third quarters of 2008. In addition, we
recognized higher gains on equity derivatives in 2009 compared to 2008.
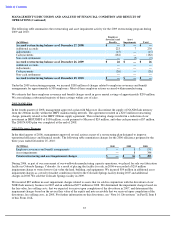
Interest and Other, Net
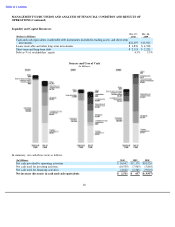
The components of interest and other, net were as follows:
Interest income was lower in 2010 compared to 2009 as a result of lower average interest rates, partially offset by higher
average investment balances. The average interest rate earned during 2010 decreased by approximately 0.5 percentage points
compared to 2009. In addition, lower fair value gains on our trading assets (zero in 2010 and $70 million in 2009) were
partially offset by lower exchange rate losses (zero in 2010 and $40 million in 2009). Exchange rate losses in 2009 were due to
euro exposure related to our euro-denominated liability for the EC fine.
We recognized lower interest income in 2009 compared to 2008 as a result of lower interest rates. The average interest rate
earned during 2009 decreased by 2.4 percentage points compared to 2008. In addition, lower gains on divestitures (zero in
2009 and $59 million in 2008) were more than offset by $70 million of fair value gains in 2009 on our trading assets,
compared to $130 million of fair value losses in 2008.
37
(In Millions)
2010
2009
2008
Impairment charges
$
(109
)
$
(179
)
$
(455
)
Gains on sales, net
185
55
60
Other, net
155
101
19
Total gains (losses) on other equity investments, net
$
231
$
(23
)
$
(376
)
(In Millions)
2010
2009
2008
Interest income
$
119
$
168
$
592
Interest expense
—
(
1
)
(8
)
Other, net
(10
)
(4
)
(96
)
Total interest and other, net
$
109
$
163
$
488