Intel 2010 Annual Report Download - page 122
Download and view the complete annual report
Please find page 122 of the 2010 Intel annual report below. You can navigate through the pages in the report by either clicking on the pages listed below, or by using the keyword search tool below to find specific information within the annual report.-
 1
1 -
2
-
3
-
4
-
5
-
6
-
7
-
8
-
9
-
10
-
11
-
12
-
13
-
14
-
15
-
16
-
17
-
18
-
19
-
20
-
21
-
22
-
23
-
24
-
25
-
26
-
27
-
28
-
29
-
30
-
31
-
32
-
33
-
34
-
35
-
36
-
37
-
38
-
39
-
40
-
41
-
42
-
43
-
44
-
45
-
46
-
47
-
48
-
49
-
50
-
51
-
52
-
53
-
54
-
55
-
56
-
57
-
58
-
59
-
60
-
61
-
62
-
63
-
64
-
65
-
66
-
67
-
68
-
69
-
70
-
71
-
72
-
73
-
74
-
75
-
76
-
77
-
78
-
79
-
80
-
81
-
82
-
83
-
84
-
85
-
86
-
87
-
88
-
89
-
90
-
91
-
92
-
93
-
94
-
95
-
96
-
97
-
98
-
99
-
100
-
101
-
102
-
103
-
104
-
105
-
106
-
107
-
108
-
109
-
110
-
111
-
 112
112 -
 113
113 -
 114
114 -
 115
115 -
 116
116 -
 117
117 -
 118
118 -
 119
119 -
 120
120 -
 121
121 -
 122
122 -
 123
123 -
 124
124 -
 125
125 -
 126
126 -
 127
127 -
 128
128 -
 129
129 -
 130
130 -
 131
131 -
 132
132 -
133
-
134
-
135
-
136
-
137
-
138
-
139
-
140
-
141
-
142
-
143
-
144
-
145
-
146
-
147
-
148
-
149
-
150
-
151
-
152
-
153
-
154
-
155
-
156
-
157
-
158
-
159
-
160
 |
 |

Table of Contents
INTEL CORPORATION
NOTES TO CONSOLIDATED FINANCIAL STATEMENTS (Continued)
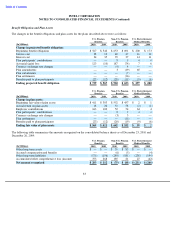
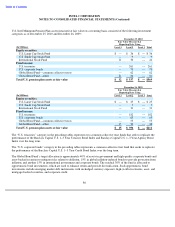
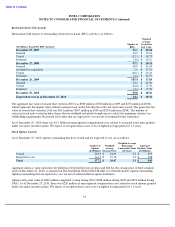
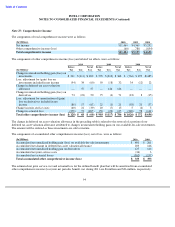
Restricted Stock Unit Awards
Information with respect to outstanding restricted stock unit (RSU) activity is as follows:
The aggregate fair value of awards that vested in 2010 was $808 million ($320 million in 2009 and $270 million in 2008),
which represents the market value of Intel common stock on the date that the restricted stock units vested. The grant date fair
value of awards that vested in 2010 was $612 million ($407 million in 2009 and $239 million in 2008). The number of
restricted stock units vested includes shares that we withheld on behalf of employees to satisfy the minimum statutory tax
withholding requirements. Restricted stock units that are expected to vest are net of estimated future forfeitures.
As of December 25, 2010, there was $1.2 billion in unrecognized compensation costs related to restricted stock units granted
under our equity incentive plans. We expect to recognize those costs over a weighted average period of 1.3 years.
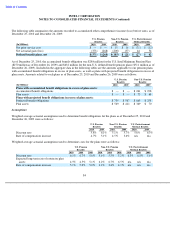
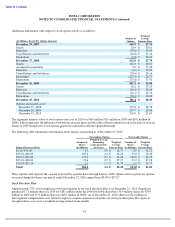
Stock Option Awards
As of December 25, 2010, options outstanding that have vested and are expected to vest are as follows:
Aggregate intrinsic value represents the difference between the exercise price and $20.84, the closing price of Intel common
stock on December 23, 2010, as reported on The NASDAQ Global Select Market, for all in-the-money options outstanding.
Options outstanding that are expected to vest are net of estimated future option forfeitures.
Options with a fair value of $240 million completed vesting during 2010 ($288 million during 2009 and $459 million during
2008). As of December 25, 2010, there was $220 million in unrecognized compensation costs related to stock options granted
under our equity incentive plans. We expect to recognize those costs over a weighted average period of 1.2 years.
91
Weighted
Average
Number of
Grant
-
Date
(In Millions, Except Per RSU Amounts)
RSUs
Fair Value
December 29, 2007
51.1
$
20.24
Granted
32.9
$
19.94
Vested
(12.1
)
$
19.75
Forfeited
(4.6
)
$
20.12
December 27, 2008
67.3
$
20.18
Granted
60.0
$
14.63
Assumed in acquisition
1.6
$
17.52
Vested
(20.1
)
$
20.24
Forfeited
(3.4
)
$
18.19
December 26, 2009
105.4
$
17.03
Granted
32.4
$
22.56
Vested
(34.6
)
$
17.70
Forfeited
(3.4
)
$
17.98
December 25, 2010
99.8
$
18.56
Expected to vest as of December 25, 2010
94.4
$
18.54
Weighted Average
Number of
Weighted
Remaining
Aggregate
Options
Average
Contractual Term
Intrinsic Value
(In Millions)
Exercise Price
(In Years)
(In Millions)
Vested
263.0
$
21.03
2.3
$
295
Expected to vest
114.2
$
19.18
5.6
$
248
Total
377.2
$
20.47
3.3
$
543