Intel 2010 Annual Report Download - page 60
Download and view the complete annual report
Please find page 60 of the 2010 Intel annual report below. You can navigate through the pages in the report by either clicking on the pages listed below, or by using the keyword search tool below to find specific information within the annual report.-
 1
1 -
2
-
3
-
4
-
5
-
6
-
7
-
8
-
9
-
10
-
11
-
12
-
13
-
14
-
15
-
16
-
17
-
18
-
19
-
20
-
21
-
22
-
23
-
24
-
25
-
26
-
27
-
28
-
29
-
30
-
31
-
32
-
33
-
34
-
35
-
36
-
37
-
38
-
39
-
40
-
41
-
42
-
43
-
44
-
45
-
46
-
47
-
48
-
49
-
 50
50 -
 51
51 -
 52
52 -
 53
53 -
 54
54 -
 55
55 -
 56
56 -
 57
57 -
 58
58 -
 59
59 -
 60
60 -
 61
61 -
 62
62 -
 63
63 -
 64
64 -
 65
65 -
 66
66 -
 67
67 -
 68
68 -
 69
69 -
 70
70 -
71
-
72
-
73
-
74
-
75
-
76
-
77
-
78
-
79
-
80
-
81
-
82
-
83
-
84
-
85
-
86
-
87
-
88
-
89
-
90
-
91
-
92
-
93
-
94
-
95
-
96
-
97
-
98
-
99
-
100
-
101
-
102
-
103
-
104
-
105
-
106
-
107
-
108
-
109
-
110
-
111
-
112
-
113
-
114
-
115
-
116
-
117
-
118
-
119
-
120
-
121
-
122
-
123
-
124
-
125
-
126
-
127
-
128
-
129
-
130
-
131
-
132
-
133
-
134
-
135
-
136
-
137
-
138
-
139
-
140
-
141
-
142
-
143
-
144
-
145
-
146
-
147
-
148
-
149
-
150
-
151
-
152
-
153
-
154
-
155
-
156
-
157
-
158
-
159
-
160
 |
 |

Table of Contents
MANAGEMENT’S DISCUSSION AND ANALYSIS OF FINANCIAL CONDITION AND RESULTS OF
OPERATIONS (Continued)
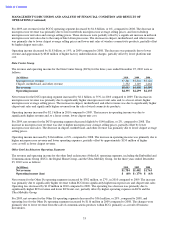
Operating Activities
Cash provided by operating activities is net income adjusted for certain non-cash items and changes in certain assets and
liabilities.
For 2010 compared to 2009, the $5.5 billion increase in cash provided by operating activities was due to higher net income,
partially offset by adjustments for non-cash items. Income taxes paid, net of refunds, in 2010 compared to 2009 were $3.7
billion higher, primarily due to higher income before taxes in 2010.
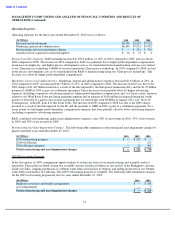
Changes in assets and liabilities as of December 25, 2010 compared to December 26, 2009 included the following:
For 2010 and 2009, our two largest customers accounted for 38% of our net revenue, with one of these customers accounting
for 21% of our net revenue in 2010 and 2009, and another customer accounting for 17% of our net revenue in 2010 and 2009.
These two largest customers accounted for 44% of our accounts receivable as of December 25, 2010 (41% as of December 26,
2009).
For 2009 compared to 2008, the $244 million increase in cash provided by operating activities was primarily due to changes in
assets and liabilities, partially offset by lower net income. Income taxes paid, net of refunds, in 2009 compared to 2008 were
$3.1 billion lower, primarily due to lower income before taxes and timing of payments.
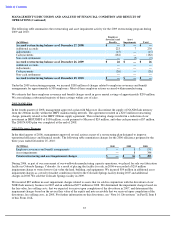
Investing Activities
Investing cash flows consist primarily of capital expenditures, net investment purchases, maturities, disposals, and cash used
for acquisitions.
The increase in cash used for investing activities in 2010 compared to 2009 was primarily due to an increase in net purchases
of available-for-sale investments and, to a lesser extent, higher capital expenditures ($5.2 billion in 2010 and $4.5 billion in
2009). These increases were partially offset by a decrease in net purchases of trading assets and lower cash paid for
acquisitions.
The increase in cash used for investing activities in 2009 compared to 2008 was primarily due to an increase in net purchases
of available-for-sale
investments and trading assets, and higher cash paid for acquisitions. These increases were partially offset
by a decrease in investments in non-marketable equity investments. Our investments in non-marketable equity investments in
2008 included $1.0 billion for an ownership interest in Clearwire LLC.
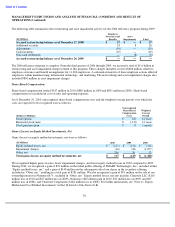
Financing Activities
Financing cash flows consist primarily of repurchases of common stock, payment of dividends to stockholders, issuance and
repayment of long-term debt, and proceeds from the sale of shares through employee equity incentive plans.
The increase in cash used in financing activities in 2010 compared to 2009 was due to the issuance of long-term debt in 2009.
During 2010, we repurchased $1.7 billion of common stock compared to $1.8 billion in 2009. As of December 25, 2010, $4.2
billion remained available for repurchase under the existing repurchase authorization of $25 billion. In January 2011, our
Board of Directors increased the repurchase authorization limit by $10 billion. We base our level of common stock
repurchases on internal cash management decisions, and this level may fluctuate. Proceeds from the sale of shares through
employee equity incentive plans totaled $587 million in 2010 compared to $400 million in 2009. Our total dividend payments
were $3.5 billion in 2010 compared to $3.1 billion in 2009 as a result of an increase in quarterly cash dividends per common
share. We have paid a cash dividend in each of the past 73 quarters. In January 2011, our Board of Directors declared a cash
dividend of $0.1812 per common share for the first quarter of 2011. The dividend is payable on March 1, 2011 to stockholders
of record on February 7, 2011.
The decrease in cash used in financing activities in 2009 compared to 2008 was primarily due to a decrease in repurchases of
common stock and the issuance of long-term debt, partially offset by lower proceeds from sales of shares through employee
equity incentive plans. We used the majority of the proceeds from the 2009 issuance of long-term debt to repurchase common
stock.
41
•
Inventories
increased due to higher microprocessor inventory, primarily due to ramping new products.
•
Accounts receivable
increased due to a higher proportion of sales at the end of the fourth quarter of 2010.
•
Accounts payable
increased due to timing of payments.