Intel 2010 Annual Report Download - page 85
Download and view the complete annual report
Please find page 85 of the 2010 Intel annual report below. You can navigate through the pages in the report by either clicking on the pages listed below, or by using the keyword search tool below to find specific information within the annual report.-
 1
1 -
2
-
3
-
4
-
5
-
6
-
7
-
8
-
9
-
10
-
11
-
12
-
13
-
14
-
15
-
16
-
17
-
18
-
19
-
20
-
21
-
22
-
23
-
24
-
25
-
26
-
27
-
28
-
29
-
30
-
31
-
32
-
33
-
34
-
35
-
36
-
37
-
38
-
39
-
40
-
41
-
42
-
43
-
44
-
45
-
46
-
47
-
48
-
49
-
50
-
51
-
52
-
53
-
54
-
55
-
56
-
57
-
58
-
59
-
60
-
61
-
62
-
63
-
64
-
65
-
66
-
67
-
68
-
69
-
70
-
71
-
72
-
73
-
74
-
 75
75 -
 76
76 -
 77
77 -
 78
78 -
 79
79 -
 80
80 -
 81
81 -
 82
82 -
 83
83 -
 84
84 -
 85
85 -
 86
86 -
 87
87 -
 88
88 -
 89
89 -
 90
90 -
 91
91 -
 92
92 -
 93
93 -
 94
94 -
 95
95 -
96
-
97
-
98
-
99
-
100
-
101
-
102
-
103
-
104
-
105
-
106
-
107
-
108
-
109
-
110
-
111
-
112
-
113
-
114
-
115
-
116
-
117
-
118
-
119
-
120
-
121
-
122
-
123
-
124
-
125
-
126
-
127
-
128
-
129
-
130
-
131
-
132
-
133
-
134
-
135
-
136
-
137
-
138
-
139
-
140
-
141
-
142
-
143
-
144
-
145
-
146
-
147
-
148
-
149
-
150
-
151
-
152
-
153
-
154
-
155
-
156
-
157
-
158
-
159
-
160
 |
 |

Table of Contents
INTEL CORPORATION
NOTES TO CONSOLIDATED FINANCIAL STATEMENTS (Continued)
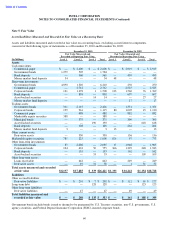
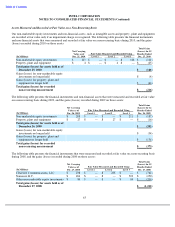
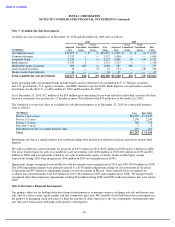
Note 5: Fair Value
Assets/Liabilities Measured and Recorded at Fair Value on a Recurring Basis
Assets and liabilities measured and recorded at fair value on a recurring basis, excluding accrued interest components,
consisted of the following types of instruments as of December 25, 2010 and December 26, 2009:
Government bonds include bonds issued or deemed to be guaranteed by U.S. Treasury securities, non-U.S. governments, U.S.
agency securities, and Federal Deposit Insurance Corporation (FDIC)-insured corporate bonds.
60
December 25, 2010
December 26, 2009
Fair Value Measured and
Fair Value Measured and
Recorded at Reporting Date Using
Recorded at Reporting Date Using
(In Millions)
Level 1
Level 2
Level 3
Total
Level 1
Level 2
Level 3
Total
Assets
Cash equivalents:
Commercial paper
$
—
$
2,600
$
—
$
2,600
$
—
$
2,919
$
—
$
2,919
Government bonds
1,279
505
—
1,784
—
—
—
—
Bank deposits
—
560
—
560
—
459
—
459
Money market fund deposits
34
—
—
34
48
—
—
48
Short
-
term investments:
Government bonds
4,890
1,320
—
6,210
—
250
—
250
Commercial paper
—
2,712
—
2,712
—
2,525
—
2,525
Corporate bonds
121
1,378
1
1,500
133
1,560
76
1,769
Bank deposits
—
858
—
858
—
697
—
697
Asset
-
backed securities
—
—
14
14
—
—
27
27
Money market fund deposits
—
—
—
—
—
17
—
17
Trading assets:
Government bonds
311
2,115
—
2,426
—
1,351
—
1,351
Corporate bonds
199
916
—
1,115
80
1,005
45
1,130
Commercial paper
—
488
—
488
—
882
—
882
Marketable equity securities
388
—
—
388
—
—
—
—
Municipal bonds
—
375
—
375
—
390
—
390
Asset
-
backed securities
—
—
190
190
—
—
618
618
Bank deposits
—
108
—
108
—
264
—
264
Money market fund deposits
3
—
—
3
13
—
—
13
Other current assets:
Derivative assets
—
330
—
330
—
136
—
136
Marketable equity securities
785
223
—
1,008
676
97
—
773
Other long
-
term investments:
Government bonds
83
2,002
—
2,085
17
1,948
—
1,965
Corporate bonds
104
601
50
755
366
1,329
248
1,943
Bank deposits
—
133
—
133
—
162
—
162
Asset
-
backed securities
—
—
53
53
—
—
109
109
Other long
-
term assets:
Loans receivable
—
642
—
642
—
249
—
249
Derivative assets
—
19
31
50
—
1
31
32
Total assets measured and recorded
at fair value
$
8,197
$
17,885
$
339
$
26,421
$
1,333
$
16,241
$
1,154
$
18,728
Liabilities
Other accrued liabilities:
Derivative liabilities
$
—
$
201
$
7
$
208
$
—
$
112
$
65
$
177
Long
-
term debt
—
—
128
128
—
—
123
123
Other long
-
term liabilities:
Derivative liabilities
—
47
—
47
—
49
—
49
Total liabilities measured and
recorded at fair value
$
—
$
248
$
135
$
383
$
—
$
161
$
188
$
349