Intel 2010 Annual Report Download - page 140
Download and view the complete annual report
Please find page 140 of the 2010 Intel annual report below. You can navigate through the pages in the report by either clicking on the pages listed below, or by using the keyword search tool below to find specific information within the annual report.-
 1
1 -
2
-
3
-
4
-
5
-
6
-
7
-
8
-
9
-
10
-
11
-
12
-
13
-
14
-
15
-
16
-
17
-
18
-
19
-
20
-
21
-
22
-
23
-
24
-
25
-
26
-
27
-
28
-
29
-
30
-
31
-
32
-
33
-
34
-
35
-
36
-
37
-
38
-
39
-
40
-
41
-
42
-
43
-
44
-
45
-
46
-
47
-
48
-
49
-
50
-
51
-
52
-
53
-
54
-
55
-
56
-
57
-
58
-
59
-
60
-
61
-
62
-
63
-
64
-
65
-
66
-
67
-
68
-
69
-
70
-
71
-
72
-
73
-
74
-
75
-
76
-
77
-
78
-
79
-
80
-
81
-
82
-
83
-
84
-
85
-
86
-
87
-
88
-
89
-
90
-
91
-
92
-
93
-
94
-
95
-
96
-
97
-
98
-
99
-
100
-
101
-
102
-
103
-
104
-
105
-
106
-
107
-
108
-
109
-
110
-
111
-
112
-
113
-
114
-
115
-
116
-
117
-
118
-
119
-
120
-
121
-
122
-
123
-
124
-
125
-
126
-
127
-
128
-
129
-
 130
130 -
 131
131 -
 132
132 -
 133
133 -
 134
134 -
 135
135 -
 136
136 -
 137
137 -
 138
138 -
 139
139 -
 140
140 -
 141
141 -
 142
142 -
 143
143 -
 144
144 -
 145
145 -
 146
146 -
 147
147 -
 148
148 -
 149
149 -
 150
150 -
151
-
152
-
153
-
154
-
155
-
156
-
157
-
158
-
159
-
160
 |
 |

Table of Contents
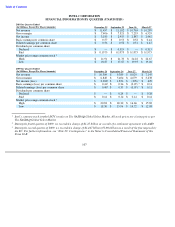
INTEL CORPORATION
FINANCIAL INFORMATION BY QUARTER (UNAUDITED)
107
2010 for Quarter Ended
(In Millions, Except Per Share Amounts)
December 25
September 25
June 26
March 27
Net revenue
$
11,457
$
11,102
$
10,765
$
10,299
Gross margin
$
7,406
$
7,321
$
7,235
$
6,529
Net income
$
3,180
$
2,955
$
2,887
$
2,442
Basic earnings per common share
$
0.57
$
0.53
$
0.52
$
0.44
Diluted earnings per common share
$
0.56
$
0.52
$
0.51
$
0.43
Dividends per common share
Declared
$
—
$
0.315
$
—
$
0.315
Paid
$
0.1575
$
0.1575
$
0.1575
$
0.1575
Market price range common stock
1
High
$
21.91
$
21.78
$
24.22
$
22.67
Low
$
18.87
$
17.67
$
19.93
$
19.02
2009 for Quarter Ended
(In Millions, Except Per Share Amounts)
December 26
September 26
June 27
March 28
Net revenue
$
10,569
$
9,389
$
8,024
$
7,145
Gross margin
$
6,840
$
5,404
$
4,079
$
3,238
Net income (loss)
$
2,282
2
$
1,856
$
(398
)
3
$
629
Basic earnings (loss) per common share
$
0.41
2
$
0.34
$
(0.07
)
3
$
0.11
Diluted earnings (loss) per common share
$
0.40
2
$
0.33
$
(0.07
)
3
$
0.11
Dividends per common share
Declared
$
—
$
0.28
$
—
$
0.28
Paid
$
0.14
$
0.14
$
0.14
$
0.14
Market price range common stock
1
High
$
20.83
$
20.32
$
16.66
$
15.82
Low
$
18.50
$
15.94
$
14.72
$
12.08
1
Intel
’s common stock (symbol INTC) trades on The NASDAQ Global Select Market. All stock prices are closing prices per
The NASDAQ Global Select Market.
2
During the fourth quarter of 2009, we recorded a charge of $1.25 billion as a result of a settlement agreement with AMD.
3
During the second quarter of 2009, we recorded a charge of $1.447 billion (
€1.06 billion) as a result of the fine imposed by
the EC. For further information, see “Note 29: Contingencies” in the Notes to Consolidated Financial Statements of this
Form
10
-
K.