Intel 2010 Annual Report Download - page 116
Download and view the complete annual report
Please find page 116 of the 2010 Intel annual report below. You can navigate through the pages in the report by either clicking on the pages listed below, or by using the keyword search tool below to find specific information within the annual report.-
 1
1 -
2
-
3
-
4
-
5
-
6
-
7
-
8
-
9
-
10
-
11
-
12
-
13
-
14
-
15
-
16
-
17
-
18
-
19
-
20
-
21
-
22
-
23
-
24
-
25
-
26
-
27
-
28
-
29
-
30
-
31
-
32
-
33
-
34
-
35
-
36
-
37
-
38
-
39
-
40
-
41
-
42
-
43
-
44
-
45
-
46
-
47
-
48
-
49
-
50
-
51
-
52
-
53
-
54
-
55
-
56
-
57
-
58
-
59
-
60
-
61
-
62
-
63
-
64
-
65
-
66
-
67
-
68
-
69
-
70
-
71
-
72
-
73
-
74
-
75
-
76
-
77
-
78
-
79
-
80
-
81
-
82
-
83
-
84
-
85
-
86
-
87
-
88
-
89
-
90
-
91
-
92
-
93
-
94
-
95
-
96
-
97
-
98
-
99
-
100
-
101
-
102
-
103
-
104
-
105
-
 106
106 -
 107
107 -
 108
108 -
 109
109 -
 110
110 -
 111
111 -
 112
112 -
 113
113 -
 114
114 -
 115
115 -
 116
116 -
 117
117 -
 118
118 -
 119
119 -
 120
120 -
 121
121 -
 122
122 -
 123
123 -
 124
124 -
 125
125 -
 126
126 -
127
-
128
-
129
-
130
-
131
-
132
-
133
-
134
-
135
-
136
-
137
-
138
-
139
-
140
-
141
-
142
-
143
-
144
-
145
-
146
-
147
-
148
-
149
-
150
-
151
-
152
-
153
-
154
-
155
-
156
-
157
-
158
-
159
-
160
 |
 |

Table of Contents
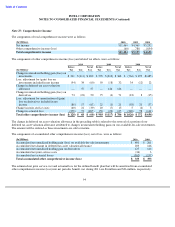
INTEL CORPORATION
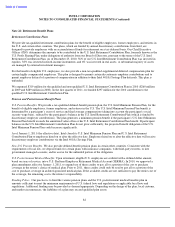
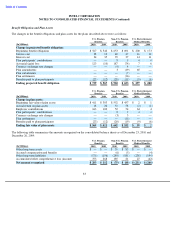
NOTES TO CONSOLIDATED FINANCIAL STATEMENTS (Continued)
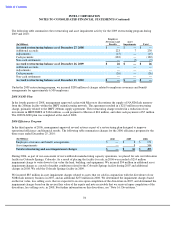
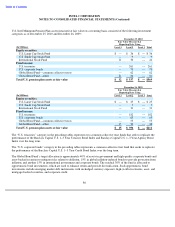
U.S. Intel Minimum Pension Plan assets measured at fair value on a recurring basis consisted of the following investment
categories as of December 25, 2010 and December 26, 2009:
The “U.S. treasuries” category in the preceding tables represents two common collective trust funds that seek to replicate the
performance of the Barclays Capital U.S. 1–3 Year Treasury Bond Index and Barclays Capital U.S. 1–3 Year Agency Bond
Index over the long term.
The “U.S. corporate bonds” category in the preceding tables represents a common collective trust fund that seeks to replicate
the performance of the Barclays Capital U.S. 1–3 Year Credit Bond Index over the long term.
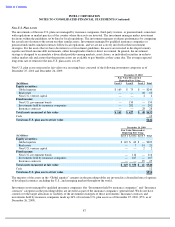
The Global Bond Fund’s target allocation is approximately 40% of assets in government and high-quality corporate bonds and
asset-backed securities to mitigate risks related to deflation, 15% in global inflation-indexed bonds to provide protection from
inflation, and another 15% in international government and corporate bonds. The residual 30% of the fund is allocated to
opportunistic bond investments, which are used to enhance return and provide diversification. Such opportunistic bond
investments include emerging market debt instruments with un-hedged currency exposure, high-yield investments, asset- and
mortgage-backed securities, and corporate credit.
86
December 25, 2010
Fair Value Measured at
Reporting Date Using
(In Millions)
Level 1
Level 2
Level 3
Total
Equity securities:
U.S. Large Cap Stock Fund
$
—
$
36
$
—
$
36
U.S. Small Cap Stock Fund
—
9
—
9
International Stock Fund
11
30
—
41
Fixed income:
U.S. treasuries
—
261
—
261
U.S. corporate bonds
—
79
—
79
Global Bond Fund
—
common collective trusts
—
62
—
62
Global Bond Fund
—
other
21
60
—
81
Total U.S. pension plan assets at fair value
$
32
$
537
$
—
$
569
December 26, 2009
Fair Value Measured at
Reporting Date Using
(In Millions)
Level 1
Level 2
Level 3
Total
Equity securities:
U.S. Large Cap Stock Fund
$
—
$
25
$
—
$
25
U.S. Small Cap Stock Fund
—
7
—
7
International Stock Fund
—
31
—
31
Fixed income:
U.S. treasuries
—
182
—
182
U.S. corporate bonds
—
65
—
65
Global Bond Fund
—
common collective trusts
—
53
—
53
Global Bond Fund
—
other
15
33
—
48
Total U.S. pension plan assets at fair value
$
15
$
396
$
—
$
411