Intel 2010 Annual Report Download - page 94
Download and view the complete annual report
Please find page 94 of the 2010 Intel annual report below. You can navigate through the pages in the report by either clicking on the pages listed below, or by using the keyword search tool below to find specific information within the annual report.-
 1
1 -
2
-
3
-
4
-
5
-
6
-
7
-
8
-
9
-
10
-
11
-
12
-
13
-
14
-
15
-
16
-
17
-
18
-
19
-
20
-
21
-
22
-
23
-
24
-
25
-
26
-
27
-
28
-
29
-
30
-
31
-
32
-
33
-
34
-
35
-
36
-
37
-
38
-
39
-
40
-
41
-
42
-
43
-
44
-
45
-
46
-
47
-
48
-
49
-
50
-
51
-
52
-
53
-
54
-
55
-
56
-
57
-
58
-
59
-
60
-
61
-
62
-
63
-
64
-
65
-
66
-
67
-
68
-
69
-
70
-
71
-
72
-
73
-
74
-
75
-
76
-
77
-
78
-
79
-
80
-
81
-
82
-
83
-
 84
84 -
 85
85 -
 86
86 -
 87
87 -
 88
88 -
 89
89 -
 90
90 -
 91
91 -
 92
92 -
 93
93 -
 94
94 -
 95
95 -
 96
96 -
 97
97 -
 98
98 -
 99
99 -
 100
100 -
 101
101 -
 102
102 -
 103
103 -
 104
104 -
105
-
106
-
107
-
108
-
109
-
110
-
111
-
112
-
113
-
114
-
115
-
116
-
117
-
118
-
119
-
120
-
121
-
122
-
123
-
124
-
125
-
126
-
127
-
128
-
129
-
130
-
131
-
132
-
133
-
134
-
135
-
136
-
137
-
138
-
139
-
140
-
141
-
142
-
143
-
144
-
145
-
146
-
147
-
148
-
149
-
150
-
151
-
152
-
153
-
154
-
155
-
156
-
157
-
158
-
159
-
160
 |
 |

Table of Contents
INTEL CORPORATION
NOTES TO CONSOLIDATED FINANCIAL STATEMENTS (Continued)
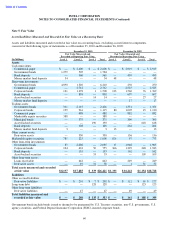
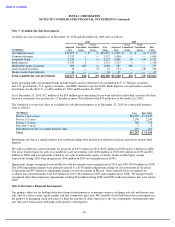
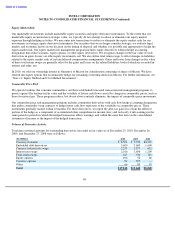
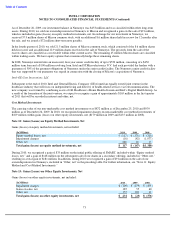
Note 7: Available-for-Sale Investments
Available-for-sale investments as of December 25, 2010 and December 26, 2009 were as follows:
In the preceding table, government bonds include bonds issued or deemed to be guaranteed by U.S. Treasury securities,
non-U.S. governments, U.S. agency securities, and FDIC-insured corporate bonds. Bank deposits were primarily issued by
institutions outside the U.S. as of December 25, 2010 and December 26, 2009.
As of December 25, 2010, $12 million of the $19 million gross unrealized losses were related to individual securities that had
been in a continuous loss position for 12 months or more ($26 million of the $33 million as of December 26, 2009).
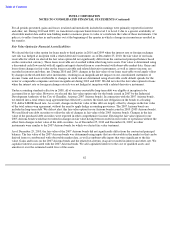
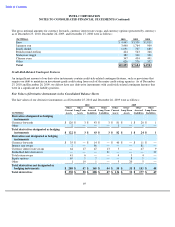
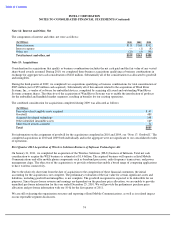
The amortized cost and fair value of available-for-sale debt investments as of December 25, 2010, by contractual maturity,
were as follows:
Instruments not due at a single maturity date in the preceding table include asset-backed securities and money market fund
deposits.
We sold available-for-sale investments for proceeds of $475 million in 2010 ($192 million in 2009 and $1.2 billion in 2008).
The gross realized gains on sales of available-for-sale investments were $160 million in 2010 ($43 million in 2009 and $38
million in 2008) and were primarily related to our sales of marketable equity securities. Gains on third-party merger
transactions during 2010 were insignificant ($56 million in 2009 and insignificant in 2008).
Impairment charges recognized on available-for-sale investments were insignificant in 2010 and 2009 ($354 million in 2008).
The 2008 impairment charges were primarily related to a $176 million impairment charge on our investment in Clearwire
Corporation and $97 million of impairment charges on our investment in Micron. Gross realized losses recognized on
available-for-sale investments were $13 million in 2010 ($64 million in 2009 and insignificant in 2008). We had previously
recognized other-than-temporary impairments totaling $34 million during 2008 and 2009 on the investments that were sold in
2009.
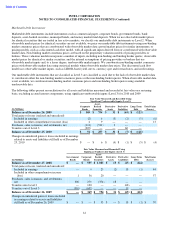
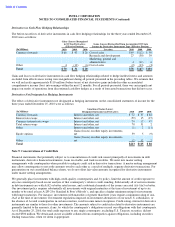
Note 8: Derivative Financial Instruments
Our primary objective for holding derivative financial instruments is to manage currency exchange rate risk and interest rate
risk, and, to a lesser extent, equity market risk and commodity price risk. We currently do not hold derivative instruments for
the purpose of managing credit risk since we limit the amount of credit exposure to any one counterparty and generally enter
into derivative transactions with high-credit-quality counterparties.
66
2010
2009
Gross
Gross
Gross
Gross
Adjusted
Unrealized
Unrealized
Fair
Adjusted
Unrealized
Unrealized
Fair
(In Millions)
Cost
Gains
Losses
Value
Cost
Gains
Losses
Value
Government bonds
$
10,075
$
9
$
(5
)
$
10,079
$
2,205
$
11
$
(1
)
$
2,215
Commercial paper
5,312
—
—
5,312
5,444
—
—
5,444
Corporate bonds
2,250
9
(4
)
2,255
3,688
38
(14
)
3,712
Bank deposits
1,550
1
—
1,551
1,317
1
—
1,318
Marketable equity securities
380
629
(1
)
1,008
387
386
—
773
Asset
-
backed securities
76
—
(
9
)
67
154
—
(
18
)
136
Money market fund deposits
34
—
—
34
65
—
—
65
Total
available
-
for
-
sale
investments
$
19,677
$
648
$
(19
)
$
20,306
$
13,260
$
436
$
(33
)
$
13,663
(In Millions)
Cost
Fair Value
Due in 1 year or less
$
16,225
$
16,225
Due in 1
–
2 years
2,190
2,200
Due in 2
–
5 years
769
770
Due after 5 years
3
2
Instruments not due at a single maturity date
110
101
Total
$
19,297
$
19,298