Intel 2010 Annual Report Download - page 69
Download and view the complete annual report
Please find page 69 of the 2010 Intel annual report below. You can navigate through the pages in the report by either clicking on the pages listed below, or by using the keyword search tool below to find specific information within the annual report.-
 1
1 -
2
-
3
-
4
-
5
-
6
-
7
-
8
-
9
-
10
-
11
-
12
-
13
-
14
-
15
-
16
-
17
-
18
-
19
-
20
-
21
-
22
-
23
-
24
-
25
-
26
-
27
-
28
-
29
-
30
-
31
-
32
-
33
-
34
-
35
-
36
-
37
-
38
-
39
-
40
-
41
-
42
-
43
-
44
-
45
-
46
-
47
-
48
-
49
-
50
-
51
-
52
-
53
-
54
-
55
-
56
-
57
-
58
-
 59
59 -
 60
60 -
 61
61 -
 62
62 -
 63
63 -
 64
64 -
 65
65 -
 66
66 -
 67
67 -
 68
68 -
 69
69 -
 70
70 -
 71
71 -
 72
72 -
 73
73 -
 74
74 -
 75
75 -
 76
76 -
 77
77 -
 78
78 -
 79
79 -
80
-
81
-
82
-
83
-
84
-
85
-
86
-
87
-
88
-
89
-
90
-
91
-
92
-
93
-
94
-
95
-
96
-
97
-
98
-
99
-
100
-
101
-
102
-
103
-
104
-
105
-
106
-
107
-
108
-
109
-
110
-
111
-
112
-
113
-
114
-
115
-
116
-
117
-
118
-
119
-
120
-
121
-
122
-
123
-
124
-
125
-
126
-
127
-
128
-
129
-
130
-
131
-
132
-
133
-
134
-
135
-
136
-
137
-
138
-
139
-
140
-
141
-
142
-
143
-
144
-
145
-
146
-
147
-
148
-
149
-
150
-
151
-
152
-
153
-
154
-
155
-
156
-
157
-
158
-
159
-
160
 |
 |

Table of Contents
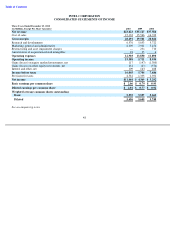
INTEL CORPORATION
CONSOLIDATED STATEMENTS OF INCOME
See accompanying notes.
48
Three Years Ended December 25, 2010
(In Millions, Except Per Share Amounts)
2010
2009
2008
Net revenue
$
43,623
$
35,127
$
37,586
Cost of sales
15,132
15,566
16,742
Gross margin
28,491
19,561
20,844
Research and development
6,576
5,653
5,722
Marketing, general and administrative
6,309
7,931
5,452
Restructuring and asset impairment charges
—
231
710
Amortization of acquisition
-
related intangibles
18
35
6
Operating expenses
12,903
13,850
11,890
Operating income
15,588
5,711
8,954
Gains (losses) on equity method investments, net
117
(147
)
(1,380
)
Gains (losses) on other equity investments, net
231
(23
)
(376
)
Interest and other, net
109
163
488
Income before taxes
16,045
5,704
7,686
Provision for taxes
4,581
1,335
2,394
Net income
$
11,464
$
4,369
$
5,292
Basic earnings per common share
$
2.06
$
0.79
$
0.93
Diluted earnings per common share
$
2.01
$
0.77
$
0.92
Weighted average common shares outstanding:
Basic
5,555
5,557
5,663
Diluted
5,696
5,645
5,748