Intel 2010 Annual Report Download - page 63
Download and view the complete annual report
Please find page 63 of the 2010 Intel annual report below. You can navigate through the pages in the report by either clicking on the pages listed below, or by using the keyword search tool below to find specific information within the annual report.-
 1
1 -
2
-
3
-
4
-
5
-
6
-
7
-
8
-
9
-
10
-
11
-
12
-
13
-
14
-
15
-
16
-
17
-
18
-
19
-
20
-
21
-
22
-
23
-
24
-
25
-
26
-
27
-
28
-
29
-
30
-
31
-
32
-
33
-
34
-
35
-
36
-
37
-
38
-
39
-
40
-
41
-
42
-
43
-
44
-
45
-
46
-
47
-
48
-
49
-
50
-
51
-
52
-
 53
53 -
 54
54 -
 55
55 -
 56
56 -
 57
57 -
 58
58 -
 59
59 -
 60
60 -
 61
61 -
 62
62 -
 63
63 -
 64
64 -
 65
65 -
 66
66 -
 67
67 -
 68
68 -
 69
69 -
 70
70 -
 71
71 -
 72
72 -
 73
73 -
74
-
75
-
76
-
77
-
78
-
79
-
80
-
81
-
82
-
83
-
84
-
85
-
86
-
87
-
88
-
89
-
90
-
91
-
92
-
93
-
94
-
95
-
96
-
97
-
98
-
99
-
100
-
101
-
102
-
103
-
104
-
105
-
106
-
107
-
108
-
109
-
110
-
111
-
112
-
113
-
114
-
115
-
116
-
117
-
118
-
119
-
120
-
121
-
122
-
123
-
124
-
125
-
126
-
127
-
128
-
129
-
130
-
131
-
132
-
133
-
134
-
135
-
136
-
137
-
138
-
139
-
140
-
141
-
142
-
143
-
144
-
145
-
146
-
147
-
148
-
149
-
150
-
151
-
152
-
153
-
154
-
155
-
156
-
157
-
158
-
159
-
160
 |
 |

Table of Contents
MANAGEMENT’S DISCUSSION AND ANALYSIS OF FINANCIAL CONDITION AND RESULTS OF
OPERATIONS (Continued)
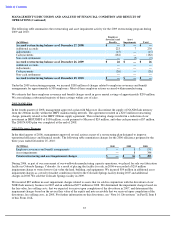
Equity Securities
As of December 25, 2010, our portfolio of assets measured and recorded at fair value on a recurring basis included $1.4 billion
of marketable equity securities. Of these securities, $1.2 billion was classified as Level 1 because the valuations were based on
quoted prices for identical securities in active markets. Our assessment of an active market for our marketable equity securities
generally takes into consideration the number of days that each individual equity security trades over a specified period. The
remaining marketable equity securities of $223 million were classified as Level 2 because their valuations were either adjusted
for security-specific restrictions or based on quoted prices for identical securities in less active markets.
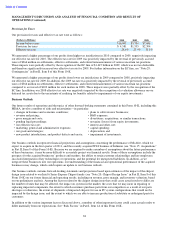
Contractual Obligations
The following table summarizes our significant contractual obligations as of December 25, 2010:
Contractual obligations for purchases of goods or services include agreements that are enforceable and legally binding on Intel
and that specify all significant terms, including fixed or minimum quantities to be purchased; fixed, minimum, or variable
price provisions; and the approximate timing of the transaction. For obligations with cancellation provisions, the amounts
included in the preceding table were limited to the non-cancelable portion of the agreement terms and/or the minimum
cancellation fee.
We have entered into certain agreements for the purchase of raw materials that specify minimum prices and quantities based
on a percentage of the total available market or based on a percentage of our future purchasing requirements. Due to the
uncertainty of the future market and our future purchasing requirements, as well as the non-binding nature of these
agreements, obligations under these agreements are not included in the preceding table. Our purchase orders for other products
are based on our current manufacturing needs and are fulfilled by our vendors within short time horizons. In addition, some of
our purchase orders represent authorizations to purchase rather than binding agreements.
43
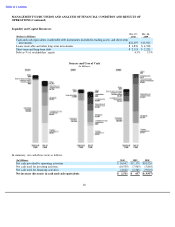
Payments Due by Period
Less Than
More Than
(In Millions)
Total
1 Year
1
–
3 Years
3
–
5 Years
5 Years
Operating lease obligations
$
327
$
102
$
142
$
52
$
31
Capital purchase obligations
1
4,576
4,260
316
—
—
Other purchase obligations and commitments
2
567
393
106
65
3
Long
-
term debt obligations
3
6,969
119
238
238
6,374
Other long
-
term liabilities
4, 5
701
252
184
133
132
Total
6
$
13,140
$
5,126
$
986
$
488
$
6,540
1
Capital purchase obligations represent commitments for the construction or purchase of property, plant and equipment.
They were not recorded as liabilities on our consolidated balance sheet as of December 25, 2010, as we had not yet
received the related goods or taken title to the property.
2
Other purchase obligations and commitments include payments due under various types of licenses and agreements to
purchase raw materials or other goods, as well as payments due under non
-contingent funding obligations. Funding
obligations include, for example, agreements to fund various projects with other companies.
3
Amounts represent principal and interest cash payments over the life of the debt obligations, including anticipated
interest payments that are not recorded on our consolidated balance sheet. Any future settlement of convertible debt
would impact our cash payments.
4
We are unable to reliably estimate the timing of future payments related to uncertain tax positions; therefore, $190
million of long-term income taxes payable has been excluded from the preceding table. However, long-term income
taxes payable, included on our consolidated balance sheet, included these uncertain tax positions, reduced by the
associated federal deduction for state taxes and U.S. tax credits arising from
non
-
U.S.
income.
5
Amounts represent future cash payments to satisfy other long
-term liabilities recorded on our consolidated balance
sheet, including the short-term portion of these long-term liabilities. Expected contributions to our U.S. and
non-U.S.
pension plans and other postretirement benefit plans of $56 million to be made during 2011 are also included;
however, funding projections beyond 2011 are not practical to estimate.
6
Total generally excludes contractual obligations already recorded on our consolidated balance sheet as current
liabilities.