Intel 2010 Annual Report Download - page 87
Download and view the complete annual report
Please find page 87 of the 2010 Intel annual report below. You can navigate through the pages in the report by either clicking on the pages listed below, or by using the keyword search tool below to find specific information within the annual report.-
 1
1 -
2
-
3
-
4
-
5
-
6
-
7
-
8
-
9
-
10
-
11
-
12
-
13
-
14
-
15
-
16
-
17
-
18
-
19
-
20
-
21
-
22
-
23
-
24
-
25
-
26
-
27
-
28
-
29
-
30
-
31
-
32
-
33
-
34
-
35
-
36
-
37
-
38
-
39
-
40
-
41
-
42
-
43
-
44
-
45
-
46
-
47
-
48
-
49
-
50
-
51
-
52
-
53
-
54
-
55
-
56
-
57
-
58
-
59
-
60
-
61
-
62
-
63
-
64
-
65
-
66
-
67
-
68
-
69
-
70
-
71
-
72
-
73
-
74
-
75
-
76
-
 77
77 -
 78
78 -
 79
79 -
 80
80 -
 81
81 -
 82
82 -
 83
83 -
 84
84 -
 85
85 -
 86
86 -
 87
87 -
 88
88 -
 89
89 -
 90
90 -
 91
91 -
 92
92 -
 93
93 -
 94
94 -
 95
95 -
 96
96 -
 97
97 -
98
-
99
-
100
-
101
-
102
-
103
-
104
-
105
-
106
-
107
-
108
-
109
-
110
-
111
-
112
-
113
-
114
-
115
-
116
-
117
-
118
-
119
-
120
-
121
-
122
-
123
-
124
-
125
-
126
-
127
-
128
-
129
-
130
-
131
-
132
-
133
-
134
-
135
-
136
-
137
-
138
-
139
-
140
-
141
-
142
-
143
-
144
-
145
-
146
-
147
-
148
-
149
-
150
-
151
-
152
-
153
-
154
-
155
-
156
-
157
-
158
-
159
-
160
 |
 |

Table of Contents
INTEL CORPORATION
NOTES TO CONSOLIDATED FINANCIAL STATEMENTS (Continued)
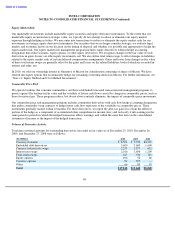
Marketable Debt Instruments
Marketable debt instruments include instruments such as commercial paper, corporate bonds, government bonds, bank
deposits, asset-backed securities, municipal bonds, and money market fund deposits. When we use observable market prices
for identical securities that are traded in less active markets, we classify our marketable debt instruments as Level 2. When
observable market prices for identical securities are not available, we price our marketable debt instruments using non-binding
market consensus prices that are corroborated with observable market data; quoted market prices for similar instruments; or
pricing models, such as a discounted cash flow model, with all significant inputs derived from or corroborated with observable
market data. Non-binding market consensus prices are based on the proprietary valuation models of pricing providers or
brokers. These valuation models incorporate a number of inputs, including non-binding and binding broker quotes; observable
market prices for identical or similar securities; and the internal assumptions of pricing providers or brokers that use
observable market inputs and, to a lesser degree, unobservable market inputs. We corroborate non-binding market consensus
prices with observable market data using statistical models when observable market data exists. The discounted cash flow
model uses observable market inputs, such as LIBOR-based yield curves, currency spot and forward rates, and credit ratings.
Our marketable debt instruments that are classified as Level 3 are classified as such due to the lack of observable market data
to corroborate either the non-binding market consensus prices or the non-binding broker quotes. When observable market data
is not available, we corroborate non-binding market consensus prices and non-binding broker quotes using available
unobservable data.
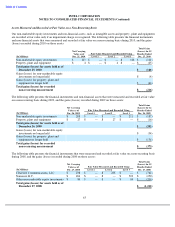
The following tables present reconciliations for all assets and liabilities measured and recorded at fair value on a recurring
basis, excluding accrued interest components, using significant unobservable inputs (Level 3) for 2010 and 2009:
61
Fair Value Measured and Recorded Using
Significant Unobservable Inputs (Level 3)
Asset
-
Corporate
Backed
Derivative
Derivative
Long-
Term
Total Gains
(In Millions)
Bonds
Securities
Assets
Liabilities
Debt
(Losses)
Balance as of December 26, 2009
$
369
$
754
$
31
$
(65
)
$
(123
)
Total gains or losses (realized and unrealized):
Included in earnings
(2
)
6
(3
)
(2
)
(5
)
(6
)
Included in other comprehensive income (loss)
4
9
—
—
—
13
Purchases, sales, issuances, and settlements, net
(113
)
(512
)
3
—
—
Transfers out of Level 3
(207
)
—
—
60
—
Balance as of December 25, 2010
$
51
$
257
$
31
$
(7
)
$
(128
)
Changes in unrealized gains or losses included in earnings
related to assets and liabilities still held as of December
25, 2010
$
—
$
6
$
(4
)
$
(1
)
$
(5
)
$
(4
)
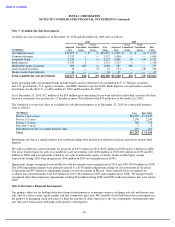
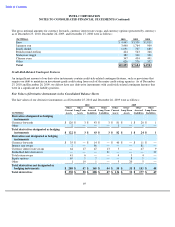
Fair Value Measured and Recorded Using
Significant Unobservable Inputs (Level 3)
Asset
-
Government
Corporate
Backed
Derivative
Derivative
Long
-
Term
Total Gains
(In Millions)
Bonds
Bonds
Securities
Assets
Liabilities
Debt
(Losses)
Balance as of December 27, 2008
$
—
$
555
$
1,083
$
15
$
(25
)
$
(122
)
Total gains or losses (realized and unrealized):
Included in earnings
—
4
25
(2
)
18
(1
)
44
Included in other comprehensive income
(loss)
1
36
20
—
—
—
57
Purchases, sales, issuances, and settlements,
net
300
279
(374
)
18
—
—
Transfers into Level 3
—
100
—
—
(
68
)
—
Transfers out of Level 3
(301
)
(605
)
—
—
10
—
Balance as of December 26, 2009
$
—
$
369
$
754
$
31
$
(65
)
$
(123
)
Changes in unrealized gains or losses included
in earnings related to assets and liabilities
still held as of December 26, 2009
$
—
$
—
$
53
$
—
$
18
$
(1
)
$
70