Intel 2010 Annual Report Download - page 107
Download and view the complete annual report
Please find page 107 of the 2010 Intel annual report below. You can navigate through the pages in the report by either clicking on the pages listed below, or by using the keyword search tool below to find specific information within the annual report.-
 1
1 -
2
-
3
-
4
-
5
-
6
-
7
-
8
-
9
-
10
-
11
-
12
-
13
-
14
-
15
-
16
-
17
-
18
-
19
-
20
-
21
-
22
-
23
-
24
-
25
-
26
-
27
-
28
-
29
-
30
-
31
-
32
-
33
-
34
-
35
-
36
-
37
-
38
-
39
-
40
-
41
-
42
-
43
-
44
-
45
-
46
-
47
-
48
-
49
-
50
-
51
-
52
-
53
-
54
-
55
-
56
-
57
-
58
-
59
-
60
-
61
-
62
-
63
-
64
-
65
-
66
-
67
-
68
-
69
-
70
-
71
-
72
-
73
-
74
-
75
-
76
-
77
-
78
-
79
-
80
-
81
-
82
-
83
-
84
-
85
-
86
-
87
-
88
-
89
-
90
-
91
-
92
-
93
-
94
-
95
-
96
-
 97
97 -
 98
98 -
 99
99 -
 100
100 -
 101
101 -
 102
102 -
 103
103 -
 104
104 -
 105
105 -
 106
106 -
 107
107 -
 108
108 -
 109
109 -
 110
110 -
 111
111 -
 112
112 -
 113
113 -
 114
114 -
 115
115 -
 116
116 -
 117
117 -
118
-
119
-
120
-
121
-
122
-
123
-
124
-
125
-
126
-
127
-
128
-
129
-
130
-
131
-
132
-
133
-
134
-
135
-
136
-
137
-
138
-
139
-
140
-
141
-
142
-
143
-
144
-
145
-
146
-
147
-
148
-
149
-
150
-
151
-
152
-
153
-
154
-
155
-
156
-
157
-
158
-
159
-
160
 |
 |

Table of Contents
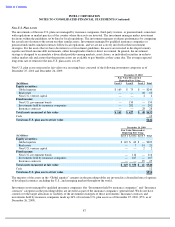
INTEL CORPORATION
NOTES TO CONSOLIDATED FINANCIAL STATEMENTS (Continued)
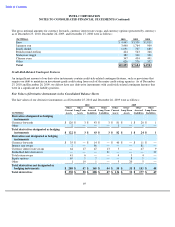
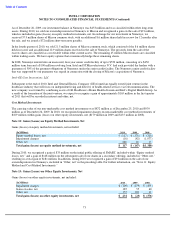
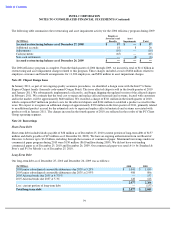
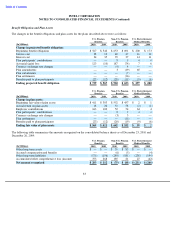
We recorded the amortization of identified intangible assets on the consolidated statements of income as cost of sales,
amortization of acquisition-related intangibles, or a reduction of revenue.
Amortization expenses for the three years ended December 25, 2010 were as follows:
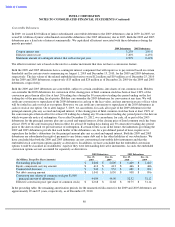
Based on identified intangible assets that are subject to amortization as of December 25, 2010, we expect amortization
expenses for each period to be as follows:
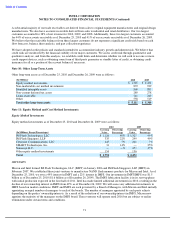
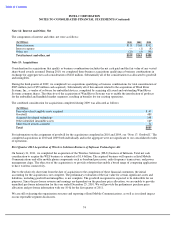
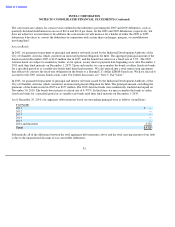
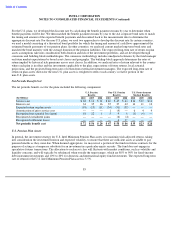
Note 19: Restructuring and Asset Impairment Charges
The following table summarizes restructuring and asset impairment charges by plan for the three years ended December 25,
2010:
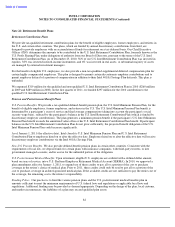
2009 Restructuring Program
In the first quarter of 2009, management approved plans to restructure some of our manufacturing and assembly and test
operations. These plans included closing two assembly and test facilities in Malaysia, one facility in the Philippines, and one
facility in China; stopping production at a 200mm wafer fabrication facility in Oregon; and ending production at our 200mm
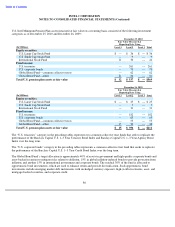
wafer fabrication facility in California. The 2009 restructuring program is complete. The following table summarizes charges
for the 2009 restructuring program for the two years ended December 25, 2010:
77
(In Millions)
2010
2009
2008
Intellectual property assets
$
149
$
149
$
164
Acquisition
-
related developed technology
$
56
$
30
$
5
Other intangible assets
$
35
$
129
$
87
(In Millions)
2011
2012
2013
2014
2015
Intellectual property assets
$
97
$
86
$
69
$
59
$
41
Acquisition
-
related developed technology
$
55
$
33
$
18
$
7
$
—
Other intangible assets
$
40
$
40
$
39
$
30
$
26
(In Millions)
2010
2009
2008
2009 restructuring program
$
—
$
215
$
—
2008 NAND plan
—
—
215
2006 efficiency program
—
16
495
Total restructuring and asset impairment charges
$
—
$
231
$
710
(In Millions)
2010
2009
Employee severance and benefit arrangements
$
—
$
208
Asset impairments
—
7
Total restructuring and asset impairment charges
$
—
$
215