Honda 2014 Annual Report Download - page 7
Download and view the complete annual report
Please find page 7 of the 2014 Honda annual report below. You can navigate through the pages in the report by either clicking on the pages listed below, or by using the keyword search tool below to find specific information within the annual report.-
 1
1 -
 2
2 -
 3
3 -
 4
4 -
 5
5 -
 6
6 -
 7
7 -
 8
8 -
 9
9 -
 10
10 -
 11
11 -
 12
12 -
 13
13 -
 14
14 -
 15
15 -
 16
16 -
 17
17 -
 18
18 -
19
-
20
-
21
-
22
-
23
-
24
-
25
-
26
-
27
-
28
-
29
-
30
-
31
-
32
-
33
-
34
-
35
-
36
-
37
-
38
-
39
-
40
-
41
-
42
-
43
-
44
-
45
-
46
-
47
-
48
-
49
-
50
-
51
-
52
-
53
-
54
-
55
-
56
-
57
-
58
-
59
-
60
-
61
-
62
 |
 |

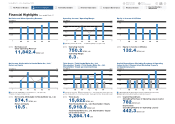
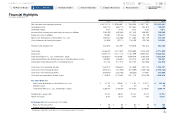
Financial Highlights
Fiscal years ended March 31
Yen (millions except per share data)
2010 2011 2012 2013 2014
Net sales and other operating revenue ¥ 8,579,174 ¥ 8,936,867 ¥ 7,948,095 ¥ 9,877,947 ¥11,842,451
Operating income 363,775 569,775 231,364 544,810 750,281
Operating margin 4.2% 6.4% 2.9% 5.5% 6.3%
Income before income taxes and equity in income of affiliates 336,198 630,548 257,403 488,891 728,940
Equity in income of affiliates 93,282 139,756 100,406 82,723 132,471
Net income attributable to Honda Motor Co., Ltd. 268,400 534,088 211,482 367,149 574,107
Cash dividends paid during the period 61,696 92,170 108,138 129,765 142,381
Research and development 463,354 487,591 519,818 560,270 634,130
Total equity 4,456,430 4,572,524 4,525,583 5,205,423 6,113,398
Total assets 11,629,115 11,577,714 11,787,599 13,635,357 15,622,031
Total Honda Motor Co., Ltd. shareholders’ equity 4,328,640 4,439,587 4,398,249 5,043,500 5,918,979
Capital expenditures (excluding purchase of operating lease assets) 348,981 326,620 424,413 630,408 782,027
Depreciation (excluding property on operating leases) 401,743 377,272 345,105 335,536 442,318
Cash flows from operating activities 1,544,212 1,096,613 761,538 800,744 1,229,191
Cash flows from investing activities (595,751) (731,390) (673,069) (1,069,756) (1,708,744)
Cash flows from financing activities (559,244) (126,192) (68,230) 119,567 370,555
Cash and cash equivalents at end of year 1,119,902 1,279,024 1,247,113 1,206,128 1,168,914
Per share data (Yen)
Net income attributable to Honda Motor Co., Ltd. ¥ 147.91 ¥ 295.67 ¥ 117.34 ¥ 203.71 ¥ 318.54
Dividends paid 34 51 60 72 79
Total Honda Motor Co., Ltd. shareholders’ equity 2,385.45 2,463.29 2,440.35 2,798.37 3,284.14
Shareholders’ equity ratio* 37.2% 38.3% 37.3% 37.0% 37.9%
Return on equity 6.4% 12.2% 4.8% 7.8% 10.5%
Exchange rate (Yen amounts per U.S. dollar)
Rates for the period-end ¥ 93 ¥ 83 ¥ 82 ¥ 94 ¥ 103
Average rates for the period 93 86 79 83 100
* Shareholders’ equity ratio: Honda Motor Co., Ltd. Shareholders’ equity / Total assets.
Honda Motor Co., Ltd. Annual Report 2014 06
2 Financial Highlights
1 The Power of Dreams
3 To Our Shareholders
4 Review of Operations
5 Corporate Governance
6 Financial Section
7
Investor Relations
Information
Return to last
page opened
Go to
contents page