Honda 2014 Annual Report Download - page 18
Download and view the complete annual report
Please find page 18 of the 2014 Honda annual report below. You can navigate through the pages in the report by either clicking on the pages listed below, or by using the keyword search tool below to find specific information within the annual report.-
 1
1 -
2
-
3
-
4
-
5
-
6
-
7
-
 8
8 -
 9
9 -
 10
10 -
 11
11 -
 12
12 -
 13
13 -
 14
14 -
 15
15 -
 16
16 -
 17
17 -
 18
18 -
 19
19 -
 20
20 -
 21
21 -
 22
22 -
 23
23 -
 24
24 -
 25
25 -
 26
26 -
 27
27 -
 28
28 -
29
-
30
-
31
-
32
-
33
-
34
-
35
-
36
-
37
-
38
-
39
-
40
-
41
-
42
-
43
-
44
-
45
-
46
-
47
-
48
-
49
-
50
-
51
-
52
-
53
-
54
-
55
-
56
-
57
-
58
-
59
-
60
-
61
-
62
 |
 |

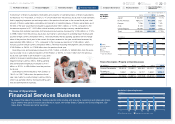
818
1,757
169 293
1,286
Japan North
AmericaEurope Asia Other
Regions
812
1,757
169 293
529
Japan North
AmericaEurope Asia Other
Regions
2,500
5,000
10,000
10 11 12 13 14
2.0
0 0.0
4.0
7,500 6.0
8.0
–2.0
(Fiscal years ended March 31)
Honda Group
Unit Sales*1 /
Consolidated
Unit Sales*2
(Thousands)
Note:
Certain sales of automobiles that
are financed with residual value
type auto loans by our Japanese
finance subsidiaries are accounted
for as operating leases in confor-
mity with U.S. generally accepted
accounting principles and are not
included in consolidated net sales
to the external customers in our
auto mobile business. As a result,
they are not included in Consoli-
dated Unit Sales, but are included
in Honda Group Unit Sales of our
automobile business.
2013 2014 % change
Japan ¥1,462,664 ¥1,714,752 17.2%
North America 3,905,276 4,717,769 20.8
Europe 388,464 487,673 25.5
Asia 1,385,449 1,599,069 15.4
Other Regions 567,363 657,097 15.8
Total ¥7,709,216 ¥9,176,360 19.0%
Net Sales
by Region
Yen (millions)
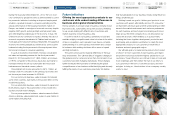
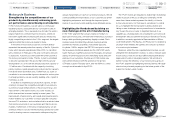
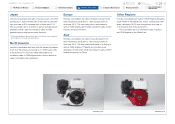
Review of Operations
Automobile Business
Honda’s consolidated unit sales of automobiles totaled 3,560 thousand units, increased by 4.5% from the previous
fiscal year, due mainly to an increase in consolidated unit sales in Japan and North America.
In automobile business operations, revenue from sales to external customers increased 19.0%, to ¥9,176.3 billion
from the previous fiscal year due mainly to increased consolidated unit sales and favorable foreign currency
translation effects. Operating income totaled ¥403.7 billion, an increase of 41.2% from the previous fiscal year,
due primarily to continuing cost reduction efforts as well as favorable foreign currency effects, despite increased
SG&A and R&D expenses.
*1 The total unit sales of completed products of Honda, its consolidated subsidiaries and
its affiliates accounted for under the equity method
*2 The total unit sales of completed products of Honda and its consolidated subsidiaries
Japan
North America
Europe
Asia
Other Regions
Operating Margin
Yen (billions) (%)
0
7,500
10,000
10 11 12 13 14
0
450
5,000 300
2,500 150
600
–150
Net Sales / Operating Income (Loss)
Yen (billions)
Net Sales (left scale) Operating Income (Loss) (right scale)
2013 2014 2013 2014
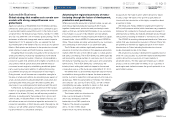
Acura MDX
Honda Motor Co., Ltd. Annual Report 2014 17
4 Review of Operations
1 The Power of Dreams
2 Financial Highlights
3 To Our Shareholders
5 Corporate Governance
6 Financial Section
7
Investor Relations
Information
Return to last
page opened
Go to
contents page