Honda 2014 Annual Report Download - page 6
Download and view the complete annual report
Please find page 6 of the 2014 Honda annual report below. You can navigate through the pages in the report by either clicking on the pages listed below, or by using the keyword search tool below to find specific information within the annual report.-
 1
1 -
 2
2 -
 3
3 -
 4
4 -
 5
5 -
 6
6 -
 7
7 -
 8
8 -
 9
9 -
 10
10 -
 11
11 -
 12
12 -
 13
13 -
 14
14 -
 15
15 -
 16
16 -
 17
17 -
18
-
19
-
20
-
21
-
22
-
23
-
24
-
25
-
26
-
27
-
28
-
29
-
30
-
31
-
32
-
33
-
34
-
35
-
36
-
37
-
38
-
39
-
40
-
41
-
42
-
43
-
44
-
45
-
46
-
47
-
48
-
49
-
50
-
51
-
52
-
53
-
54
-
55
-
56
-
57
-
58
-
59
-
60
-
61
-
62
 |
 |

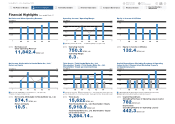
Net Sales and Other Operating Revenue
Yen (billions)
4,000
8,000
12,000
010 11 12 13 14
Net Income Attributable to Honda Motor Co., Ltd. /
Return on Equity
Yen (billions) (%)
200
400
600
0
5
10
15
0
10 11 12 13 14
Operating Income / Operating Margin
Yen (billions) (%)
400
200
600
800
0
4.0
2.0
6.0
8.0
0
10 11 12 13 14
Total Assets / Total Honda Motor Co., Ltd.
Shareholders’ Equity / Total Honda Motor Co., Ltd.
Shareholders’ Equity per Common Share
Yen (billions) (Yen)
8,000
4,000
12,000
16,000
0
2,000
1,000
3,000
4,000
0
10 11 12 13 14
Equity in Income of Affiliates
Yen (billions)
50
100
150
010 11 12 13 14
Capital Expenditures (Excluding Purchase of Operating
Lease Assets) / Depreciation (Excluding Property
on Operating Leases)
Yen (billions)
400
200
600
800
010 11 12 13 14
2014 Operating Income
750.2 billion yen
Operating Margin
6.3 %
2014 Capital Expenditures
(Excluding Purchase of Operating Lease Assets)
782 billion yen
Depreciation
(Excluding Property on Operating Leases)
442.3 billion yen
2014 Total Assets
15,622 billion yen
Total Honda Motor Co., Ltd. Shareholders’ Equity
5,918.9 billion yen
Total Honda Motor Co., Ltd. Shareholders’ Equity
per Common Share
3,284.14 yen
2014 Net Income Attributable to Honda Motor Co., Ltd.
574.1 billion yen
Return on Equity
10.5 %
2014 Net Sales and
Other Operating Revenue
11,842.4 billion yen
2014 Equity in Income of Affiliates
132.4 billion yen
Operating Income (left scale) Operating Margin (%) (right scale)
Capital Expenditures (Excluding Purchase of Operating Lease Assets)
Depreciation (Excluding Property on Operating Leases)
Total Assets (left scale) Total Honda Motor Co., Ltd. Shareholders’ Equity (left scale)
Total Honda Motor Co., Ltd. Shareholders’ Equity per Common Share (right scale)
Net Income Attributable to Honda Motor Co., Ltd. (left scale)
Return on Equity (%) (right scale)
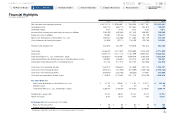
Financial Highlights Years ended March 31
Honda Motor Co., Ltd. Annual Report 2014 05
2 Financial Highlights
1 The Power of Dreams
3 To Our Shareholders
4 Review of Operations
5 Corporate Governance
6 Financial Section
7
Investor Relations
Information
Return to last
page opened
Go to
contents page