Honda 2014 Annual Report Download - page 21
Download and view the complete annual report
Please find page 21 of the 2014 Honda annual report below. You can navigate through the pages in the report by either clicking on the pages listed below, or by using the keyword search tool below to find specific information within the annual report.-
 1
1 -
2
-
3
-
4
-
5
-
6
-
7
-
8
-
9
-
10
-
 11
11 -
 12
12 -
 13
13 -
 14
14 -
 15
15 -
 16
16 -
 17
17 -
 18
18 -
 19
19 -
 20
20 -
 21
21 -
 22
22 -
 23
23 -
 24
24 -
 25
25 -
 26
26 -
 27
27 -
 28
28 -
 29
29 -
 30
30 -
 31
31 -
32
-
33
-
34
-
35
-
36
-
37
-
38
-
39
-
40
-
41
-
42
-
43
-
44
-
45
-
46
-
47
-
48
-
49
-
50
-
51
-
52
-
53
-
54
-
55
-
56
-
57
-
58
-
59
-
60
-
61
-
62
 |
 |

100
200
400
10 11 12 13 14
6.0
0 0.0
12.0
300 18.0
24.0
–6.0
(Fiscal years ended March 31)
Honda Group
Unit Sales /
Consolidated
Unit Sales
(Thousands)
314
2,718
1,032
472
1,500
Japan North
AmericaEurope Asia Other
Regions
2013 2014 % change
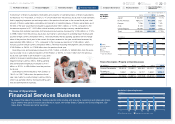
Japan ¥ 83,100 ¥ 77,964 (6.2)%
North America 84,685 97,414 15.0
Europe 52,373 64,234 22.6
Asia 36,967 40,297 9.0
Other Regions 23,551 24,366 3.5
Total ¥280,676 ¥304,275 8.4 %
Net Sales
by Region
Yen (millions)
Review of Operations
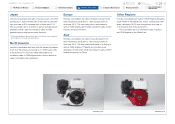
Power Product and Other Businesses
Honda’s consolidated unit sales of power products totaled 6,036 thousand units, decreased by 0.6% from the
previous fiscal year, due mainly to a decrease in consolidated unit sales in Asia and Other Regions, which was
partially offset by an increase in unit sales in North America.
Revenue from sales to external customers in power product and other businesses increased 8.4%, to ¥304.2 billion
from the previous fiscal year, due mainly to favorable foreign currency translation effects. Honda reported an
operating loss of ¥1.7 billion, an improvement of ¥7.7 billion from the previous fiscal year, due mainly to favorable
foreign currency effects.
Note: In power product business, there is no discrepancy between Honda Group Unit
Sales and Consolidated Unit Sales
Japan
North America
Europe
Asia
Other Regions
Operating Margin
2013 2014
Yen (billions) (%)
0
400
10 11 12 13 14
0
40
200 20
–20
Net Sales / Operating Loss
Yen (billions)
Net Sales (left scale) Operating Loss (right scale)
HS1336i
Honda Motor Co., Ltd. Annual Report 2014 20
4 Review of Operations
1 The Power of Dreams
2 Financial Highlights
3 To Our Shareholders
5 Corporate Governance
6 Financial Section
7
Investor Relations
Information
Return to last
page opened
Go to
contents page