Honda 2014 Annual Report Download - page 45
Download and view the complete annual report
Please find page 45 of the 2014 Honda annual report below. You can navigate through the pages in the report by either clicking on the pages listed below, or by using the keyword search tool below to find specific information within the annual report.-
 1
1 -
2
-
3
-
4
-
5
-
6
-
7
-
8
-
9
-
10
-
11
-
12
-
13
-
14
-
15
-
16
-
17
-
18
-
19
-
20
-
21
-
22
-
23
-
24
-
25
-
26
-
27
-
28
-
29
-
30
-
31
-
32
-
33
-
34
-
 35
35 -
 36
36 -
 37
37 -
 38
38 -
 39
39 -
 40
40 -
 41
41 -
 42
42 -
 43
43 -
 44
44 -
 45
45 -
 46
46 -
 47
47 -
 48
48 -
 49
49 -
 50
50 -
 51
51 -
 52
52 -
 53
53 -
 54
54 -
 55
55 -
56
-
57
-
58
-
59
-
60
-
61
-
62
 |
 |

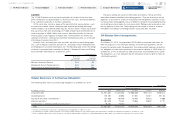
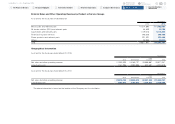
The following tables provide information about Honda’s financial instruments
that were sensitive to changes in interest rates at March 31, 2013 and 2014. For
finance receivables and long-term debt, these tables present principal cash flows,
fair value and related weighted average interest rates. For interest rate swaps and
currency and interest rate swaps, the table presents notional amounts, fair value
and weighted average interest rates. Variable interest rates are determined using
formulas such as LIBOR+a and an index.
Interest Rate Risk
Finance Subsidiaries-Receivables 2013 2014
Fiscal years ended March 31 Yen (millions) Yen (millions)
Average
interest
rate
(%)
Expected maturity date
Total Fair value Total
Within
1 year
1–2
years
2–3
years
3–4
years
4–5
years
There-
after
Fair
value
Direct financing leases
JP¥ ¥ 106,735 —¥ 119,306 30,150 24,279 28,626 20,627 15,495 129 —4.11
Other 341,937 —303,630 84,685 91,847 77,264 36,722 13,112 — — 2.27
Total—Direct financing leases ¥ 448,672 —¥ 422,936 114,835 116,126 105,890 57,349 28,607 129 — —
Other finance subsidiaries-receivables
JP¥ ¥ 542,165 544,441 ¥ 628,167 172,864 146,967 124,724 93,550 60,716 29,346 611,136 3.61
US$ 3,025,075 3,059,686 3,607,002 1,314,043 854,711 677,423 461,577 233,548 65,700 3,637,098 3.20
Other 730,185 722,206 940,967 390,809 307,445 112,589 73,018 33,715 23,391 927,330 6.68
Total—Other finance subsidiaries-receivables ¥4,297,425 4,326,333 ¥5,176,136 1,877,716 1,309,123 914,736 628,145 327,979 118,437 5,175,564 —
Total*2¥4,746,097 —¥5,599,072 — — — — — — — —
*1 Under U.S. generally accepted accounting principles, disclosure of fair values of direct financing leases is not required.
*2 The finance subsidiaries-receivables include finance subsidiaries-receivables contained in trade accounts and notes receivable and other assets in the consolidated balance sheets.
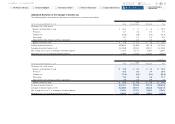
Long-Term Debt (including current portion) 2013 2014
Fiscal years ended March 31 Yen (millions) Yen (millions)
Average
interest
rate
(%)
Expected maturity date
Total Fair value Total
Within
1 year
1–2
years
2–3
years
3–4
years
4–5
years
There-
after
Fair
value
Japanese yen bonds ¥ 340,000 342,627 ¥ 450,000 30,000 60,000 80,000 95,000 130,000 55,000 452,373 0.48
Japanese yen medium-term notes (Fixed rate) 42,923 43,445 36,378 5,982 27,405 ———2,991 36,924 0.73
Japanese yen medium-term notes (Floating rate) 5,490 5,488 1,994 —1,994 ————1,995 0.22
U.S. dollar medium-term notes (Fixed rate) 942,086 994,988 1,062,127 221,278 202,745 231,570 128,650 174,964 102,920 1,101,604 2.45
U.S. dollar medium-term notes (Floating rate) 235,427 237,547 515,612 226,424 52,987 209,442 10,292 16,467 —518,199 0.63
Asset backed notes 681,020 684,741 808,022 412,200 267,532 109,093 16,135 2,519 543 811,297 0.70
Loans and others—primarily fixed rate 1,408,945 1,419,185 1,663,397 407,580 350,799 495,091 140,927 136,780 132,220 1,675,351 1.99
Total ¥3,655,891 3,728,021 ¥4,537,530 1,303,464 963,462 1,125,196 391,004 460,730 293,674 4,597,743 —
Honda Motor Co., Ltd. Annual Report 2014 44
6 Financial Section
1 The Power of Dreams
2 Financial Highlights
3 To Our Shareholders
4 Review of Operations
5 Corporate Governance
7
Investor Relations
Information
Return to last
page opened
Go to
contents page