Honda 2014 Annual Report Download - page 57
Download and view the complete annual report
Please find page 57 of the 2014 Honda annual report below. You can navigate through the pages in the report by either clicking on the pages listed below, or by using the keyword search tool below to find specific information within the annual report.-
 1
1 -
2
-
3
-
4
-
5
-
6
-
7
-
8
-
9
-
10
-
11
-
12
-
13
-
14
-
15
-
16
-
17
-
18
-
19
-
20
-
21
-
22
-
23
-
24
-
25
-
26
-
27
-
28
-
29
-
30
-
31
-
32
-
33
-
34
-
35
-
36
-
37
-
38
-
39
-
40
-
41
-
42
-
43
-
44
-
45
-
46
-
 47
47 -
 48
48 -
 49
49 -
 50
50 -
 51
51 -
 52
52 -
 53
53 -
 54
54 -
 55
55 -
 56
56 -
 57
57 -
 58
58 -
 59
59 -
 60
60 -
 61
61 -
 62
62
 |
 |

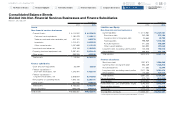
Consolidated Statements of Cash Flows
Divided into Non-Financial Services Businesses and Finance Subsidiaries
Fiscal years ended March 31, 2013 and 2014 Yen (millions)
2013 2014
Non-financial
services
businesses
Finance
subsidiaries
Reconciling
Items Consolidated
Non-financial
services
businesses
Finance
subsidiaries
Reconciling
Items Consolidated
Cash flows from operating activities:
Net Income ¥ 295,590 ¥ 97,048 ¥ — ¥ 392,638 ¥ 492,714 ¥ 116,035 ¥ —¥ 608,749
Adjustments to reconcile net income to net cash provided
by operating activities:
Depreciation 334,303 256,166 —590,469 440,016 354,704 —794,720
Deferred income taxes 32,022 21,230 —53,252 40,687 4,739 —45,426
Equity in income of affiliates (82,723) — — (82,723) (132,471) — — (132,471)
Dividends from affiliates 84,705 — — 84,705 98,955 — — 98,955
Impairment loss on long-lived assets —4,773 —4,773 —3,301 —3,301
Loss (gain) on derivative instruments, net 28,426 6,601 —35,027 (47,049) 7,673 —(39,376)
Decrease (increase) in trade accounts and notes receivable (3,881) (87,972) 1,358 (90,495) (78,470) (16,839) 2,671 (92,638)
Decrease (increase) in inventories (74,662) — — (74,662) (2,901) — — (2,901)
Increase (decrease) in trade accounts and notes payable (92,277) —(2,915) (95,192) 80,400 48 (9,460) 70,988
Other, net 16,791 (43,499) 9,660 (17,048) (35,936) (89,747) 121 (125,562)
Net cash provided by (used in) operating activities 538,294 254,347 8,103 800,744 855,945 379,914 (6,668) 1,229,191
Cash flows from investing activities:
Decrease (increase) in investments and advances* 14,836 (670) (21,218) (7,052) (32,170) (5,071) 2,496 (34,745)
Capital expenditures (625,128) (1,751) —(626,879) (770,085) (3,921) —(774,006)
Proceeds from sales of property, plant and equipment 44,039 143 —44,182 30,509 3,560 —34,069
Proceeds from insurance recoveries for damage property, plant and equipment 9,600 — — 9,600 6,800 — — 6,800
Collections (acquisitions) of finance subsidiaries—receivables —(118,006) (127) (118,133) —(450,107) 11,362 (438,745)
Purchase of operating lease assets —(793,118) —(793,118) —(1,127,840) —(1,127,840)
Proceeds from sales of operating lease assets —418,086 —418,086 —611,317 —611,317
Other, net 3,558 — — 3,558 14,406 — — 14,406
Net cash provided by (used in) investing activities (553,095) (495,316) (21,345) (1,069,756) (750,540) (972,062) 13,858 (1,708,744)
Cash flows from financing activities:
Proceeds from (repayment of) short-term debt, net* 65,845 72,307 15,587 153,739 (84,858) 73,142 7,388 (4,328)
Proceeds from long-term debt* 82,281 1,025,408 (6,220) 1,101,469 129,742 1,473,794 (14,710) 1,588,826
Repayment of long-term debt* (117,784) (856,793) 3,875 (970,702) (76,684) (963,043) 132 (1,039,595)
Dividends paid (129,765) — — (129,765) (142,381) — — (142,381)
Dividends paid to noncontrolling interests (6,250) — — (6,250) (9,677) — — (9,677)
Sales (purchases) of treasury stock, net (7) — — (7) (25) — — (25)
Other, net (28,917) — — (28,917) (22,265) — — (22,265)
Net cash provided by (used in) financing activities (134,597) 240,922 13,242 119,567 (206,148) 583,893 (7,190) 370,555
Effect of exchange rate changes on cash and cash equivalents 105,242 3,218 —108,460 69,325 2,459 —71,784
Net change in cash and cash equivalents (44,156) 3,171 —(40,985) (31,418) (5,796) —(37,214)
Cash and cash equivalents at beginning of period 1,224,185 22,928 —1,247,113 1,180,029 26,099 —1,206,128
Cash and cash equivalents at end of period ¥1,180,029 ¥ 26,099 ¥ — ¥ 1,206,128 ¥1,148,611 ¥ 20,303 ¥ —¥ 1,168,914
Notes: 1. Non-financial services businesses provide loans to finance subsidiaries. These cash flows are included in the decrease (increase) in investments and advances, proceeds from (repayment of) short-term debt, proceeds
from long-term debt, and repayment of long-term debt (marked by *). The amount of the loans to finance subsidiaries is a JPY 21,218 million decrease for the fiscal year ended March 31, 2013, and a JPY 2,496
million increase for the fiscal year ended March 31, 2014, respectively.
2. Decrease (increase) in trade accounts and notes receivable for finance subsidiaries is due to the reclassification of finance subsidiaries-receivables which relate to sales of inventory in the unaudited consolidated
statements of cash flows presented above.
Honda Motor Co., Ltd. Annual Report 2014 56
6 Financial Section
1 The Power of Dreams
2 Financial Highlights
3 To Our Shareholders
4 Review of Operations
5 Corporate Governance
7
Investor Relations
Information
Return to last
page opened
Go to
contents page