Honda 2014 Annual Report Download - page 34
Download and view the complete annual report
Please find page 34 of the 2014 Honda annual report below. You can navigate through the pages in the report by either clicking on the pages listed below, or by using the keyword search tool below to find specific information within the annual report.-
 1
1 -
2
-
3
-
4
-
5
-
6
-
7
-
8
-
9
-
10
-
11
-
12
-
13
-
14
-
15
-
16
-
17
-
18
-
19
-
20
-
21
-
22
-
23
-
 24
24 -
 25
25 -
 26
26 -
 27
27 -
 28
28 -
 29
29 -
 30
30 -
 31
31 -
 32
32 -
 33
33 -
 34
34 -
 35
35 -
 36
36 -
 37
37 -
 38
38 -
 39
39 -
 40
40 -
 41
41 -
 42
42 -
 43
43 -
 44
44 -
45
-
46
-
47
-
48
-
49
-
50
-
51
-
52
-
53
-
54
-
55
-
56
-
57
-
58
-
59
-
60
-
61
-
62
 |
 |

Revenue from external customers increased by ¥23.5 billion, or 8.4%, to
¥304.2 billion from the previous fiscal year, due mainly to positive foreign currency
translation effects. Honda estimates that by applying Japanese yen exchange
rates of the previous fiscal year to the current fiscal year, net sales for the year
would have decreased by approximately ¥10.4 billion, or 3.7%, compared to the
increase as reported of ¥23.5 billion, which includes positive foreign currency
translation effects. Revenue including intersegment sales increased by ¥26.5
billion, or 9.1%, to ¥318.1 billion from the previous fiscal year.
Operating costs and expenses increased by ¥18.7 billion, or 6.2%, to ¥319.9
billion from the previous fiscal year. Cost of sales increased by ¥12.2 billion, or
5.7%, to ¥227.1 billion, due mainly to negative foreign currency effects. Selling,
general and administrative expenses increased by ¥6.5 billion, or 11.6%, to ¥63.1
billion. R&D expenses decreased by ¥0.1 billion, or 0.4%, to ¥29.6 billion.
Operating loss was ¥1.7 billion, an improvement of ¥7.7 billion from the previous
fiscal year, due mainly to positive foreign currency effects.
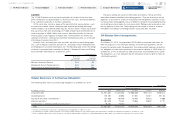
Financial Services Business
To support the sale of its products, Honda provides retail lending and leasing to
customers and wholesale financing to dealers through our finance subsidiaries in
Japan, the United States, Canada, the United Kingdom, Germany, Brazil, Thailand
and other countries.
Total amount of finance subsidiaries-receivables and property on operating
leases of finance subsidiaries increased by ¥1,144.2 billion, or 19.5%, to ¥7,018.4
billion from the previous fiscal year. Honda estimates that by applying Japanese
yen exchange rates of the previous fiscal year to the current fiscal year, total
amount of finance subsidiaries-receivables and property on operating leases of
finance subsidiaries as of the end of the year would have increased by approxi-
mately ¥641.4 billion, or 10.9%, compared to the increase as reported of ¥1,144.2
billion, which includes positive foreign currency translation effects.
Revenue from external customers in Financial services business increased by
¥149.6 billion, or 27.3%, to ¥698.1 billion from the previous fiscal year, due mainly
to an increase in operating lease revenues and positive foreign currency translation
effects. Honda estimates that by applying Japanese yen exchange rates of the
previous fiscal year to the current fiscal year, revenue for the year would have
increased by approximately ¥39.4 billion, or 7.2%, compared to the increase as
reported of ¥149.6 billion, which includes positive foreign currency translation
effects. Revenue including intersegment sales increased by ¥148.3 billion, or
26.5%, to ¥708.5 billion from the previous fiscal year.
Operating costs and expenses increased by ¥123.7 billion, or 30.8%, to
¥525.8 billion from the previous fiscal year. Cost of sales increased by ¥103.9
billion, or 30.9%, to ¥440.1 billion from the previous fiscal year, due mainly to an
increase in costs attributable to increased operating lease revenues and negative
foreign currency effects. Selling, general and administrative expenses increased by
¥19.7 billion, or 30.0%, to ¥85.6 billion from the previous fiscal year.
Operating income increased by ¥24.5 billion, or 15.6%, to ¥182.7 billion from
the previous fiscal year, due mainly to positive foreign currency effects, which was
partially offset by increased selling, general and administrative expenses.
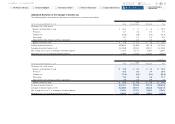
Geographical Information
Japan
In Japan, revenue from domestic and export sales increased by ¥298.7 billion,
or 7.7%, to ¥4,192.2 billion from the previous fiscal year, due mainly to an
increase in revenue in Automobile business and Motorcycle business. Operating
income increased by ¥35.6 billion, or 20.0%, to ¥214.0 billion from the previous
fiscal year, due mainly to positive foreign currency effects, which was partially
offset by increased R&D expenses and increased selling, general and administra-
tive expenses.
North America
In North America, which mainly consists of the United States, revenue increased
by ¥1,112.8 billion, or 22.9%, to ¥5,969.9 billion from the previous fiscal year, due
mainly to an increase in revenue in Automobile business and positive foreign cur-
rency translation effects. Operating income increased by ¥81.9 billion, or 39.2%,
to ¥290.9 billion from the previous fiscal year, due mainly to continuing cost reduc-
tion and positive foreign currency effects, which was partially offset by increased
selling, general and administrative expenses.
Europe
In Europe, revenue increased by ¥133.1 billion, or 20.7%, to ¥775.2 billion from
the previous fiscal year, due mainly to positive foreign currency translation effects,
which was partially offset by a decrease in revenue in Motorcycle business and
Automobile business. Operating loss was ¥17.1 billion, a decrease of ¥17.5 billion
of operating income from the previous fiscal year, due mainly to a decrease in
income attributable to decreased net sales and model mix, which was partially
offset by decreased selling, general and administrative expenses and positive
foreign currency effects.
Asia
In Asia, revenue increased by ¥521.2 billion, or 22.6%, to ¥2,826.9 billion from the
previous fiscal year, due mainly to an increase in revenue in Motorcycle business
and positive foreign currency translation effects. Operating income increased by
¥71.1 billion, or 48.5%, to ¥217.9 billion from the previous fiscal year, due mainly
to an increase in income attributable to increased net sales and model mix and
positive foreign currency effects, which was partially offset by increased selling,
general and administrative expenses.
Honda Motor Co., Ltd. Annual Report 2014 33
6 Financial Section
1 The Power of Dreams
2 Financial Highlights
3 To Our Shareholders
4 Review of Operations
5 Corporate Governance
7
Investor Relations
Information
Return to last
page opened
Go to
contents page