Honda 2014 Annual Report Download - page 59
Download and view the complete annual report
Please find page 59 of the 2014 Honda annual report below. You can navigate through the pages in the report by either clicking on the pages listed below, or by using the keyword search tool below to find specific information within the annual report.-
 1
1 -
2
-
3
-
4
-
5
-
6
-
7
-
8
-
9
-
10
-
11
-
12
-
13
-
14
-
15
-
16
-
17
-
18
-
19
-
20
-
21
-
22
-
23
-
24
-
25
-
26
-
27
-
28
-
29
-
30
-
31
-
32
-
33
-
34
-
35
-
36
-
37
-
38
-
39
-
40
-
41
-
42
-
43
-
44
-
45
-
46
-
47
-
48
-
 49
49 -
 50
50 -
 51
51 -
 52
52 -
 53
53 -
 54
54 -
 55
55 -
 56
56 -
 57
57 -
 58
58 -
 59
59 -
 60
60 -
 61
61 -
 62
62
 |
 |

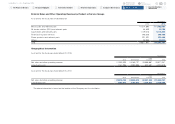
Yen
2004 2005 2006 2007 2008 2009 2010 2011 2012 2013 2014
Per common share
Net income attributable to
Honda Motor Co., Ltd.:
Basic ¥ 243.45 ¥ 260.34 ¥ 324.33 ¥ 324.62 ¥ 330.54 ¥ 75.50 ¥ 147.91 ¥ 295.67 ¥ 117.34 ¥ 203.71 ¥ 318.54
Diluted 243.45 260.34 324.33 324.62 330.54 75.50 147.91 295.67 117.34 203.71 318.54
Cash dividends paid during
the period 17.5 25.5 38.5 77 84 77 34 51 60 72 79
Honda Motor Co., Ltd.
shareholders’ equity 1,527.45 1,778.24 2,259.26 2,463.69 2,507.79 2,208.35 2,385.45 2,463.29 2,440.35 2,798.37 3,284.14
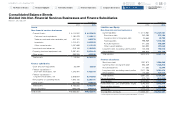
Yen (millions)
Sales progress
Sales amounts:*1
Japan ¥1,628,493 ¥1,699,205 ¥ 1,694,044 ¥ 1,681,190 ¥ 1,585,777 ¥ 1,446,541 ¥ 1,577,318 ¥ 1,503,842 ¥ 1,517,927 ¥ 1,652,995 ¥ 1,912,504
20% 20% 17% 15% 13% 14% 18% 17% 19% 17% 16%
Overseas 6,534,107 6,950,900 8,213,952 9,405,950 10,417,057 8,564,700 7,001,856 7,433,025 6,430,168 8,224,952 9,929,947
80% 80% 83% 85% 87% 86% 82% 83% 81% 83% 84%
Total ¥8,162,600 ¥8,650,105 ¥ 9,907,996 ¥11,087,140 ¥12,002,834 ¥10,011,241 ¥ 8,579,174 ¥ 8,936,867 ¥ 7,948,095 ¥ 9,877,947 ¥11,842,451
100% 100% 100% 100% 100% 100% 100% 100% 100% 100% 100%
Thousands
Unit sales:*2
Motorcycles 9,206 10,482 10,271 10,369 9,320 10,114 9,639 18,331 15,061 15,494 17,021
Automobiles 2,983 3,242 3,391 3,652 3,925 3,517 3,392 3,529 3,108 4,014 4,323
Power Products 5,047 5,300 5,876 6,421 6,057 5,187 4,744 5,509 5,819 6,071 6,036
Number of employees 131,600 137,827 144,785 167,231 178,960 181,876 176,815 179,060 187,094 190,338 198,561
Exchange rate
(yen amounts per U.S. dollar)
Rates for the period-end ¥ 106 ¥ 107 ¥ 117 ¥ 118 ¥ 100 ¥ 98 ¥ 93 ¥ 83 ¥ 82 ¥ 94 ¥ 103
Average rates for the period 113 108 113 117 114 101 93 86 79 83 100
*1 The geographic breakdown of sales amounts is based on the location of customers.
*2 Honda changed its counting method for unit sales as follows;
· 2004–2010: the total of unit sales of completed products of Honda and its consolidated subsidiaries, and sales of parts for local production at Honda’s affiliates accounted for under the equity method
· 2011–2014: the total of unit sales of completed products of Honda, its consolidated subsidiaries and its affiliates accounted for under the equity method (Honda Group Unit Sales)
Financial Summary (continued)
Honda Motor Co., Ltd. Annual Report 2014 58
6 Financial Section
1 The Power of Dreams
2 Financial Highlights
3 To Our Shareholders
4 Review of Operations
5 Corporate Governance
7
Investor Relations
Information
Return to last
page opened
Go to
contents page