Honda 2014 Annual Report Download - page 23
Download and view the complete annual report
Please find page 23 of the 2014 Honda annual report below. You can navigate through the pages in the report by either clicking on the pages listed below, or by using the keyword search tool below to find specific information within the annual report.-
 1
1 -
2
-
3
-
4
-
5
-
6
-
7
-
8
-
9
-
10
-
11
-
12
-
 13
13 -
 14
14 -
 15
15 -
 16
16 -
 17
17 -
 18
18 -
 19
19 -
 20
20 -
 21
21 -
 22
22 -
 23
23 -
 24
24 -
 25
25 -
 26
26 -
 27
27 -
 28
28 -
 29
29 -
 30
30 -
 31
31 -
 32
32 -
 33
33 -
34
-
35
-
36
-
37
-
38
-
39
-
40
-
41
-
42
-
43
-
44
-
45
-
46
-
47
-
48
-
49
-
50
-
51
-
52
-
53
-
54
-
55
-
56
-
57
-
58
-
59
-
60
-
61
-
62
 |
 |

250
500
750
010 11 12 13 14
20.0
40.0
60.0
0.0
(Fiscal years ended March 31)
2013 2014 % change
Japan ¥ 34,282 ¥ 40,333 17.7%
North America 484,275 610,848 26.1
Europe 7,256 12,646 74.3
Asia 3,145 8,051 156.0
Other Regions 19,548 26,307 34.6
Total ¥548,506 ¥698,185 27.3%
Net Sales
by Region
Yen (millions)
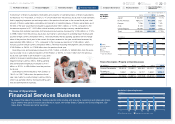
Yen (billions) 2010 2011 2012 2013 2014
Finance Receivables ¥3,461.5 ¥3,480.0 ¥3,446.1 ¥4,031.1 ¥4,781.7
Property on
Operating Leases 1,308.1 1,357.6 1,472.7 1,843.1 2,236.7
Total ¥4,769.6 ¥4,837.6 ¥4,918.8 ¥5,874.2 ¥7,018.4
Finance Receivables / Property on Operating Leases
Total amount of finance subsidiaries-receivables and property on operating leases of finance subsidiaries
increased by ¥1,144.2 billion, or 19.5%, to ¥7,018.4 billion from the previous fiscal year. Honda estimates
that by applying Japanese yen exchange rates of the previous fiscal year to the current fiscal year, total
amount of finance subsidiaries-receivables and property on operating leases of finance subsidiaries as of
the end of the year would have increased by approximately ¥641.4 billion, or 10.9%, compared to the
increase as reported of ¥1,144.2 billion, which includes positive foreign currency translation effects.
Revenue from external customers in Financial services business increased by ¥149.6 billion, or 27.3%,
to ¥698.1 billion from the previous fiscal year, due mainly to an increase in operating lease revenues and
positive foreign currency translation effects. Honda estimates that by applying Japanese yen exchange
rates of the previous fiscal year to the current fiscal year, revenue for the year would have increased by
approximately ¥39.4 billion, or 7.2%, compared to the increase as reported of ¥149.6 billion, which
includes positive foreign currency translation effects. Revenue including intersegment sales increased by
¥148.3 billion, or 26.5%, to ¥708.5 billion from the previous fiscal year.
Operating costs and expenses increased by ¥123.7 billion, or 30.8%, to ¥525.8 billion from the previ-
ous fiscal year. Cost of sales increased by ¥103.9 billion, or 30.9%, to ¥440.1 billion from the previous
fiscal year, due mainly to an increase in costs attrib-
utable to increased operating lease revenues and
negative foreign currency effects. Selling, general
and administrative expenses increased by ¥19.7
billion, or 30.0%, to ¥85.6 billion from the previous
fiscal year.
Operating income increased by ¥24.5 billion, or
15.6%, to ¥182.7 billion from the previous fiscal
year, due mainly to positive foreign currency effects,
which was partially offset by increased selling, gen-
eral and administrative expenses.
Review of Operations
Financial Services Business
To support the sale of its products, Honda provides retail lending and leasing to customers and wholesale financ-
ing to dealers through our finance subsidiaries in Japan, the United States, Canada, the United Kingdom, Ger-
many, Brazil, Thailand and other countries.
Japan
North America
Europe
Asia
Other Regions
Operating Margin
200
600
800
010 11 12 13 14
100
300
400 200
400
0
Net Sales / Operating Income
Yen (billions)
Net Sales (left scale) Operating Income (right scale)
Yen (billions) (%)
Honda Motor Co., Ltd. Annual Report 2014 22
4 Review of Operations
1 The Power of Dreams
2 Financial Highlights
3 To Our Shareholders
5 Corporate Governance
6 Financial Section
7
Investor Relations
Information
Return to last
page opened
Go to
contents page