Honda 2014 Annual Report Download - page 37
Download and view the complete annual report
Please find page 37 of the 2014 Honda annual report below. You can navigate through the pages in the report by either clicking on the pages listed below, or by using the keyword search tool below to find specific information within the annual report.-
 1
1 -
2
-
3
-
4
-
5
-
6
-
7
-
8
-
9
-
10
-
11
-
12
-
13
-
14
-
15
-
16
-
17
-
18
-
19
-
20
-
21
-
22
-
23
-
24
-
25
-
26
-
 27
27 -
 28
28 -
 29
29 -
 30
30 -
 31
31 -
 32
32 -
 33
33 -
 34
34 -
 35
35 -
 36
36 -
 37
37 -
 38
38 -
 39
39 -
 40
40 -
 41
41 -
 42
42 -
 43
43 -
 44
44 -
 45
45 -
 46
46 -
 47
47 -
48
-
49
-
50
-
51
-
52
-
53
-
54
-
55
-
56
-
57
-
58
-
59
-
60
-
61
-
62
 |
 |

year ended March 31, 2014, totaling ¥13,580 million, were deployed to upgrade,
streamline, and modernize manufacturing facilities for power products, and to
improve R&D facilities for power products.
Plans after Fiscal Year 2014
During the fiscal year ended March 31, 2014, we modified our capital expenditure
plans which were originally set out in the prior fiscal year. The modified plans are
as follows:
The scale of a test course in a new R&D facility, which is under construction in
Sakura-shi, Tochigi, Japan, has been changed. Also, a mega-solar power plant
will be built on its property.
Managements mainly consider economic trends of each region, demand
trends, situation of competitors and our business strategy such as introduction
plans of new models in determining the future of projects.
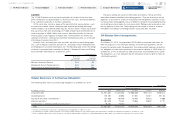
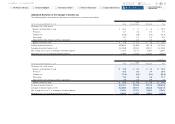
The estimated amounts of capital expenditures for fiscal year ending March 31,
2015 are shown below.
Yen (millions)
Fiscal year ending March 31, 2015 2015
Motorcycle Business ¥ 77,400
Automobile Business 559,900
Financial Services Business 900
Power Product and Other Businesses 11,800
Total ¥650,000
Note: The estimated amount of capital expenditures for Financial services business in the above table does
not include property on operating leases.
Intangible assets are not included in the table above.
Liquidity and Capital Resources
Overview of Capital Requirements, Sources and Uses
The policy of Honda is to support its business activities by maintaining sufficient
capital resources, a sufficient level of liquidity and a sound balance sheet.
Honda’s main business is the manufacturing and sale of motorcycles, automo-
biles and power products. To support this business, it also provides retail financing
and automobile leasing services for customers, as well as wholesale financing
services for dealers.
Honda requires working capital mainly to purchase parts and raw materials
required for production, as well as to maintain inventory of finished products and
cover receivables from dealers and for providing financial services. Honda also
requires funds for capital expenditures, mainly to introduce new models, upgrade,
rationalize and renew production facilities, as well as to expand and reinforce sales
and R&D facilities.
Honda meets its working capital requirements primarily through cash generated
by operations and bank loans. Honda believes that its working capital is sufficient
for the Company’s present requirements. The year-end balance of liabilities associ-
ated with the Company and its subsidiaries’ funding for non-Financial services
businesses was ¥565.3 billion as of March 31, 2014. In addition, the Company’s
finance subsidiaries fund financial programs for customers and dealers primarily
from medium-term notes, bank loans, securitization of finance receivables, com-
mercial paper, corporate bonds, and intercompany loans. The year-end balance of
liabilities associated with these finance subsidiaries’ funding for Financial services
business was ¥5,838.2 billion as of March 31, 2014.
Cash Flows
Consolidated cash and cash equivalents on March 31, 2014 decreased by ¥37.2
billion from March 31, 2013, to ¥1,168.9 billion. The reasons for the increases or
decreases for each cash flow activity, when compared with the previous fiscal
year, are as follows:
Net cash provided by operating activities amounted to ¥1,229.1 billion of cash
inflows. Cash inflows from operating activities increased by ¥428.4 billion com-
pared with the previous fiscal year, due mainly to an increase in cash received due
to increased unit sales in Automobile business, which was partially offset by
increased payments for parts and raw materials.
Net cash used in investing activities amounted to ¥1,708.7 billion of cash out-
flows. Cash outflows from investing activities increased by ¥638.9 billion compared
with the previous fiscal year, due mainly to an increase in acquisitions of finance
subsidiaries-receivables and purchases of operating lease assets, which was par-
tially offset by an increase in collections of finance subsidiaries-receivables.
Net cash provided by financing activities amounted to ¥370.5 billion of cash
inflows. Cash inflows from financing activities increased by ¥250.9 billion com-
pared with the previous fiscal year, due mainly to an increase in proceeds from
debt, which was partially offset by an increase in dividends paid.
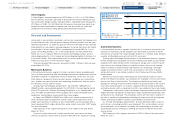
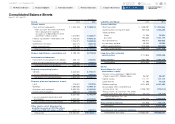
Yen (billions)
Capital Expenditures
and Depreciation
Fiscal years ended March 31
Capital Expenditures
Depreciation
250
500
750
010 11 12 13 14
Note: Capital Expenditure and Depreciation aforementioned exclude Capital Expenditure and Depreciation in
operating lease assets and intangible assets.
Honda Motor Co., Ltd. Annual Report 2014 36
6 Financial Section
1 The Power of Dreams
2 Financial Highlights
3 To Our Shareholders
4 Review of Operations
5 Corporate Governance
7
Investor Relations
Information
Return to last
page opened
Go to
contents page