Honda 2014 Annual Report Download - page 58
Download and view the complete annual report
Please find page 58 of the 2014 Honda annual report below. You can navigate through the pages in the report by either clicking on the pages listed below, or by using the keyword search tool below to find specific information within the annual report.-
 1
1 -
2
-
3
-
4
-
5
-
6
-
7
-
8
-
9
-
10
-
11
-
12
-
13
-
14
-
15
-
16
-
17
-
18
-
19
-
20
-
21
-
22
-
23
-
24
-
25
-
26
-
27
-
28
-
29
-
30
-
31
-
32
-
33
-
34
-
35
-
36
-
37
-
38
-
39
-
40
-
41
-
42
-
43
-
44
-
45
-
46
-
47
-
 48
48 -
 49
49 -
 50
50 -
 51
51 -
 52
52 -
 53
53 -
 54
54 -
 55
55 -
 56
56 -
 57
57 -
 58
58 -
 59
59 -
 60
60 -
 61
61 -
 62
62
 |
 |

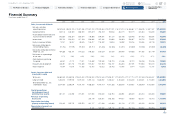
Financial Summary
Fiscal years ended March 31
Yen (millions)
2004 2005 2006 2007 2008 2009 2010 2011 2012 2013 2014
Sales, income and dividends
Net sales and other
operating revenue ¥8,162,600 ¥8,650,105 ¥ 9,907,996 ¥11,087,140 ¥12,002,834 ¥10,011,241 ¥ 8,579,174 ¥ 8,936,867 ¥ 7,948,095 ¥ 9,877,947 ¥11,842,451
Operating income 600,144 630,920 868,905 851,879 953,109 189,643 363,775 569,775 231,364 544,810 750,281
Income before income taxes and
equity in income of affiliates 653,680 668,364 829,904 792,868 895,841 161,734 336,198 630,548 257,403 488,891 728,940
Income taxes 252,740 266,665 317,189 283,846 387,436 109,835 146,869 206,827 135,735 178,976 252,662
Equity in income of affiliates 75,151 96,057 99,605 103,417 118,942 99,034 93,282 139,756 100,406 82,723 132,471
Net income attributable to
noncontrolling interests (11,753) (11,559) (15,287) (20,117) (27,308) (13,928) (14,211) (29,389) (10,592) (25,489) (34,642)
Net income attributable to Honda
Motor Co., Ltd. 464,338 486,197 597,033 592,322 600,039 137,005 268,400 534,088 211,482 367,149 574,107
Net income as a percentage
of net sales 5.7% 5.6% 6.0% 5.3% 5.0% 1.4% 3.1% 6.0% 2.7% 3.7% 4.8%
Cash dividends paid during
the period 33,541 47,797 71,061 140,482 152,590 139,724 61,696 92,170 108,138 129,765 142,381
Research and development 448,967 467,754 510,385 551,847 587,959 563,197 463,354 487,591 519,818 560,270 634,130
Interest expense 10,194 11,655 11,902 12,912 16,623 22,543 12,552 8,474 10,378 12,157 12,703
Assets, long-term debt and
shareholders’ equity
Total assets ¥8,380,549 ¥9,368,236 ¥10,631,400 ¥12,036,500 ¥12,615,543 ¥11,818,917 ¥11,629,115 ¥11,577,714 ¥11,787,599 ¥13,635,357 ¥15,622,031
Long-term debt 1,394,612 1,559,500 1,879,000 1,905,743 1,836,652 1,932,637 2,313,035 2,043,240 2,235,001 2,710,845 3,234,066
Total Honda Motor Co., Ltd.
shareholders’ equity 2,874,400 3,289,294 4,125,750 4,488,825 4,550,479 4,007,288 4,328,640 4,439,587 4,398,249 5,043,500 5,918,979
Capital expenditures
(excluding purchase of
operating lease assets) 287,741 373,980 457,841 627,066 654,030 633,913 348,981 326,620 424,413 630,408 782,027
Purchase of operating
lease assets 366,795 839,261 668,128 544,027 798,420 683,767 793,118 1,127,840
Depreciation (excluding
property on operating leases) 213,445 225,752 262,225 361,747 417,393 441,868 401,743 377,272 345,105 335,536 442,318
Depreciation of property on
operating leases 9,741 101,032 195,776 227,931 212,143 209,762 254,933 352,402
Honda Motor Co., Ltd. Annual Report 2014 57
6 Financial Section
1 The Power of Dreams
2 Financial Highlights
3 To Our Shareholders
4 Review of Operations
5 Corporate Governance
7
Investor Relations
Information
Return to last
page opened
Go to
contents page