Honda 2014 Annual Report Download - page 53
Download and view the complete annual report
Please find page 53 of the 2014 Honda annual report below. You can navigate through the pages in the report by either clicking on the pages listed below, or by using the keyword search tool below to find specific information within the annual report.-
 1
1 -
2
-
3
-
4
-
5
-
6
-
7
-
8
-
9
-
10
-
11
-
12
-
13
-
14
-
15
-
16
-
17
-
18
-
19
-
20
-
21
-
22
-
23
-
24
-
25
-
26
-
27
-
28
-
29
-
30
-
31
-
32
-
33
-
34
-
35
-
36
-
37
-
38
-
39
-
40
-
41
-
42
-
 43
43 -
 44
44 -
 45
45 -
 46
46 -
 47
47 -
 48
48 -
 49
49 -
 50
50 -
 51
51 -
 52
52 -
 53
53 -
 54
54 -
 55
55 -
 56
56 -
 57
57 -
 58
58 -
 59
59 -
 60
60 -
 61
61 -
 62
62
 |
 |

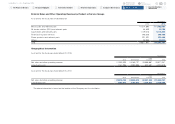
Segment Information (continued)
As of and for the fiscal year ended March 31, 2014
Yen (millions)
Motorcycle
Business
Automobile
Business
Financial
Services
Business
Power Product
and Other
Businesses
Segment
Total
Reconciling
Items Consolidated
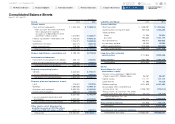
Net sales and other operating revenue:
External customers ¥1,663,631 ¥9,176,360 ¥ 698,185 ¥304,275 ¥11,842,451 ¥ — ¥11,842,451
Intersegment —18,569 10,403 13,900 42,872 (42,872) —
Total 1,663,631 9,194,929 708,588 318,175 11,885,323 (42,872) 11,842,451
Cost of sales, SG&A and R&D expenses 1,498,026 8,791,228 525,832 319,956 11,135,042 (42,872) 11,092,170
Segment income (loss) 165,605 403,701 182,756 (1,781) 750,281 —750,281
Equity in income of affiliates 36,479 94,506 —1,486 132,471 —132,471
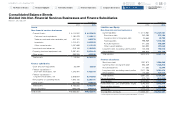
Segment assets 1,264,903 6,398,580 7,980,989 346,177 15,990,649 (368,618) 15,622,031
Investments in affiliates 102,359 439,556 —20,749 562,664 —562,664
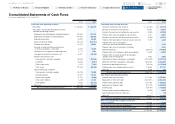
Depreciation and amortization 46,038 383,325 354,704 10,653 794,720 —794,720
Capital expenditures 57,702 705,696 1,131,761 14,708 1,909,867 —1,909,867
Impairment loss on long-lived assets — — 3,301 —3,301 —3,301
Provision for credit and lease residual losses
on finance subsidiaries—receivables — — 18,904 —18,904 —18,904
Explanatory notes:
1. Segment income (loss) of each segment is measured in a consistent manner with consolidated operating income, which is income before income taxes and equity in income of affiliates before other income (expenses).
Expenses not directly associated with specific segments are allocated based on the most reasonable measures applicable.
2. Segment assets of each segment are defined as total assets, including derivative financial instruments, investments in affiliates, and deferred tax assets. Segment assets are based on those directly associated with each
segment and those not directly associated with specific segments are allocated based on the most reasonable measures applicable except for the corporate assets described below.
3. Intersegment sales and revenues are generally made at values that approximate arm’s-length prices.
4. Unallocated corporate assets, included in reconciling items, amounted to ¥293,583 million as of March 31, 2013 and ¥294,819 million as of March 31, 2014, respectively, which consist primarily of cash and cash
equivalents, available-for-sale securities and held-to-maturity securities held by the Company. Reconciling items also include elimination of intersegment transactions.
5. Depreciation and amortization of Financial services business include ¥254,933 million for the year ended March 31, 2013 and ¥352,402 million for the year ended March 31, 2014, respectively, of depreciation of property
on operating leases.
6. Capital expenditures of Financial services business includes ¥793,118 million for the year ended March 31, 2013 and ¥1,127,840 million for the year ended March 31, 2014, respectively, of purchases of operating lease assets.
7. Liabilities accrued for warranties issued are ¥97,108 million and ¥153,898 million, for the years ended March 31, 2013 and 2014, respectively. These are mainly included in Cost of sales, SG&A and R&D expenses of
Automobile business.
Honda Motor Co., Ltd. Annual Report 2014 52
6 Financial Section
1 The Power of Dreams
2 Financial Highlights
3 To Our Shareholders
4 Review of Operations
5 Corporate Governance
7
Investor Relations
Information
Return to last
page opened
Go to
contents page