Home Depot 2006 Annual Report Download - page 80
Download and view the complete annual report
Please find page 80 of the 2006 Home Depot annual report below. You can navigate through the pages in the report by either clicking on the pages listed below, or by using the keyword search tool below to find specific information within the annual report.-
 1
1 -
2
-
3
-
4
-
5
-
6
-
7
-
8
-
9
-
10
-
11
-
12
-
13
-
14
-
15
-
16
-
17
-
18
-
19
-
20
-
21
-
22
-
23
-
24
-
25
-
26
-
27
-
28
-
29
-
30
-
31
-
32
-
33
-
34
-
35
-
36
-
37
-
38
-
39
-
40
-
41
-
42
-
43
-
44
-
45
-
46
-
47
-
48
-
49
-
50
-
51
-
52
-
53
-
54
-
55
-
56
-
57
-
58
-
59
-
60
-
61
-
62
-
63
-
64
-
65
-
66
-
67
-
68
-
69
-
 70
70 -
 71
71 -
 72
72 -
 73
73 -
 74
74 -
 75
75 -
 76
76 -
 77
77 -
 78
78 -
 79
79 -
 80
80 -
 81
81 -
 82
82 -
 83
83 -
 84
84
 |
 |

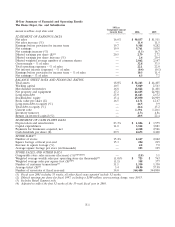
10-Year Summary of Financial and Operating Results
The Home Depot, Inc. and Subsidiaries 10-Year
Compound Annual
amounts in millions, except where noted Growth Rate 2006 2005
STATEMENT OF EARNINGS DATA
Net sales 16.6% $ 90,837 $ 81,511
Net sales increase (%) — 11.4 11.5
Earnings before provision for income taxes 19.7 9,308 9,282
Net earnings 19.9 5,761 5,838
Net earnings increase (%) — (1.3) 16.7
Diluted earnings per share ($)(2) 20.5 2.79 2.72
Diluted earnings per share increase (%) — 2.6 20.4
Diluted weighted average number of common shares — 2,062 2,147
Gross margin – % of sales — 32.8 33.5
Total operating expenses – % of sales — 22.1 22.0
Net interest income (expense) – % of sales — (0.4) (0.1)
Earnings before provision for income taxes – % of sales — 10.3 11.4
Net earnings – % of sales — 6.3 7.2
BALANCE SHEET DATA AND FINANCIAL RATIOS
Total assets 18.8% $ 52,263 $ 44,405
Working capital 10.5 5,069 2,563
Merchandise inventories 16.8 12,822 11,401
Net property and equipment 17.2 26,605 24,901
Long-term debt 25.0 11,643 2,672
Stockholders’ equity 15.4 25,030 26,909
Book value per share ($) 16.5 12.71 12.67
Long-term debt-to-equity (%) — 46.5 9.9
Total debt-to-equity (%) — 46.6 15.2
Current ratio — 1.39:1 1.20:1
Inventory turnover — 4.7x 4.8x
Return on invested capital (%) — 20.5 22.4
STATEMENT OF CASH FLOWS DATA
Depreciation and amortization 23.3% $ 1,886 $ 1,579
Capital expenditures 11.0 3,542 3,881
Payments for businesses acquired, net — 4,268 2,546
Cash dividends per share ($) 29.5 0.675 0.400
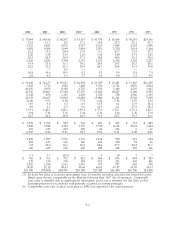
STORE DATA(3)
Number of stores 15.4% 2,147 2,042
Square footage at fiscal year-end 15.3 224 215
Increase in square footage (%) — 4.2 7.0
Average square footage per store (in thousands) — 105 105
STORE SALES AND OTHER DATA
Comparable store sales increase (decrease) (%)(3)(4)(5)(6) —(2.8) 3.1
Weighted average weekly sales per operating store (in thousands)(3) (1.0)% $ 723 $ 763
Weighted average sales per square foot ($)(3)(4) (1.1) 358 377
Number of customer transactions(3) 11.1 1,330 1,330
Average ticket ($)(3) 3.4 58.90 57.98
Number of associates at fiscal year-end 14.0 364,400 344,800
(1) Fiscal year 2001 includes 53 weeks; all other fiscal years reported include 52 weeks.
(2) Diluted earnings per share for fiscal 1997, excluding a $104 million non-recurring charge, were $0.55.
(3) Includes Retail Segment only.
(4) Adjusted to reflect the first 52 weeks of the 53-week fiscal year in 2001.
F-1