Home Depot 2006 Annual Report Download - page 32
Download and view the complete annual report
Please find page 32 of the 2006 Home Depot annual report below. You can navigate through the pages in the report by either clicking on the pages listed below, or by using the keyword search tool below to find specific information within the annual report.-
 1
1 -
2
-
3
-
4
-
5
-
6
-
7
-
8
-
9
-
10
-
11
-
12
-
13
-
14
-
15
-
16
-
17
-
18
-
19
-
20
-
21
-
 22
22 -
 23
23 -
 24
24 -
 25
25 -
 26
26 -
 27
27 -
 28
28 -
 29
29 -
 30
30 -
 31
31 -
 32
32 -
 33
33 -
 34
34 -
 35
35 -
 36
36 -
 37
37 -
 38
38 -
 39
39 -
 40
40 -
 41
41 -
 42
42 -
43
-
44
-
45
-
46
-
47
-
48
-
49
-
50
-
51
-
52
-
53
-
54
-
55
-
56
-
57
-
58
-
59
-
60
-
61
-
62
-
63
-
64
-
65
-
66
-
67
-
68
-
69
-
70
-
71
-
72
-
73
-
74
-
75
-
76
-
77
-
78
-
79
-
80
-
81
-
82
-
83
-
84
 |
 |

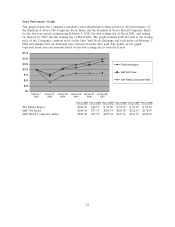
Results of Operations
For an understanding of the significant factors that influenced our performance during the past three
fiscal years, the following discussion should be read in conjunction with the Consolidated Financial
Statements and the Notes to Consolidated Financial Statements presented in this report.
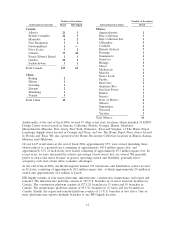
We operate in two reportable business segments: Retail and HD Supply. The Retail segment is
principally engaged in the operation of retail stores located in the United States, Canada, Mexico and
our recently acquired stores in China. The HD Supply segment distributes products and sells
installation services to business-to-business customers, including home builders, professional contractors,
municipalities and maintenance professionals. We identify segments based on how management makes
operating decisions, assesses performance and allocates resources. The first quarter of fiscal 2006 was
the first period in which we began to report our results of operations in two segments. This change was
a result of the purchase of Hughes Supply, which significantly increased the size of HD Supply and
resulted in changes in our internal reporting and management structure.
The Retail segment includes The Home Depot stores, EXPO Design Center stores (‘‘EXPO’’) and
other retail formats. The Retail segment also includes our retail services business and our catalog and
on-line sales businesses.
The HD Supply segment consists of four major platforms: 1) infrastructure, including waterworks and
utilities; 2) construction, including construction supply, lumber and building materials, electrical,
plumbing/HVAC and interiors; 3) maintenance, including facilities maintenance and industrial PVF; and
4) repair and remodel.
Fiscal 2006 Compared to Fiscal 2005
Net Sales
Total Net Sales for fiscal 2006 increased 11.4%, or $9.3 billion, to $90.8 billion from $81.5 billion for
fiscal 2005. Of the $9.3 billion increase, $7.3 billion, net of intercompany sales, came from our HD
Supply segment and $2.0 billion came from our Retail segment.
Net Sales for our Retail segment were $79.0 billion for fiscal 2006, a 2.6% increase over fiscal 2005.
Fiscal 2006 Retail segment Net Sales growth was primarily driven by sales from new stores. Retail
comparable store sales decreased 2.8% for fiscal 2006 compared to an increase of 3.1% for fiscal 2005.
The decline in retail comparable store sales was driven by a 4.6% decline in comparable store customer
transactions offset in part by a 1.6% increase in average ticket. Our average ticket increased to $58.90
for fiscal 2006 and increased in 8 of 10 selling departments. The decrease in retail comparable store
sales for fiscal 2006 was due to the significant slowdown in the U.S. retail home improvement market
as well as difficult year-over-year comparisons due to sales arising from hurricane activity in fiscal 2005.
Both Canada and Mexico, however, experienced positive retail comparable store sales for fiscal 2006.
Additionally, our retail comparable store sales results reflect in part the impact of cannibalization. In
order to meet our customer service objectives, we strategically open stores near market areas served by
existing stores (‘‘cannibalize’’) to enhance service levels, gain incremental sales and increase market
penetration. Our new stores cannibalized approximately 13.5% of our existing stores during fiscal 2006,
which had a negative impact to retail comparable store sales of approximately 1.9%.
Despite the difficult U.S. retail home improvement market, we continued to expand our retail services
revenue, which increased 8.3% to $3.8 billion for fiscal 2006 from $3.5 billion for fiscal 2005. The
growth in retail services revenue was driven by strength in a number of areas including countertops,
exterior patios, solar, windows and HVAC. Our retail services programs focus primarily on providing
products and services to our do-it-for-me customers. Our services revenue is expected to benefit from
the growing percentage of aging ‘‘baby-boomers’’ as they rely more heavily on installation services.
22