Home Depot 2006 Annual Report Download - page 36
Download and view the complete annual report
Please find page 36 of the 2006 Home Depot annual report below. You can navigate through the pages in the report by either clicking on the pages listed below, or by using the keyword search tool below to find specific information within the annual report.-
 1
1 -
2
-
3
-
4
-
5
-
6
-
7
-
8
-
9
-
10
-
11
-
12
-
13
-
14
-
15
-
16
-
17
-
18
-
19
-
20
-
21
-
22
-
23
-
24
-
25
-
 26
26 -
 27
27 -
 28
28 -
 29
29 -
 30
30 -
 31
31 -
 32
32 -
 33
33 -
 34
34 -
 35
35 -
 36
36 -
 37
37 -
 38
38 -
 39
39 -
 40
40 -
 41
41 -
 42
42 -
 43
43 -
 44
44 -
 45
45 -
 46
46 -
47
-
48
-
49
-
50
-
51
-
52
-
53
-
54
-
55
-
56
-
57
-
58
-
59
-
60
-
61
-
62
-
63
-
64
-
65
-
66
-
67
-
68
-
69
-
70
-
71
-
72
-
73
-
74
-
75
-
76
-
77
-
78
-
79
-
80
-
81
-
82
-
83
-
84
 |
 |

Liquidity and Capital Resources
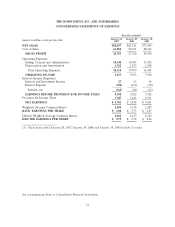
Cash flow generated from operations provides a significant source of liquidity. For fiscal 2006, Net
Cash Provided by Operating Activities was $7.7 billion as compared to $6.6 billion for fiscal 2005. The
increase was primarily a result of more productive working capital in fiscal 2006.
Net Cash Used in Investing Activities increased to $7.6 billion for fiscal 2006 from $4.6 billion for fiscal
2005. This increase was primarily the result of an increase in Payments for Businesses Acquired of
$1.7 billion as well as a decrease in net Proceeds from Sales and Maturities of Investments of
$1.7 billion, partially offset by a $339 million decrease in Capital Expenditures. We paid $4.3 billion to
complete 15 acquisitions in fiscal 2006, including Hughes Supply. Our fiscal 2006 acquisitions resulted
in increases in Receivables, Merchandise Inventories, Goodwill, Other Assets and Accounts Payable in
the Consolidated Balance Sheet as of January 28, 2007. See Note 11 to our ‘‘Notes to Consolidated
Financial Statements’’ included in Item 8 of this report for further discussion.
Additionally in fiscal 2006, we spent $3.5 billion on Capital Expenditures, allocated as follows: 64% for
new stores, 11% for store modernization, 6% for technology and 19% for other initiatives. In fiscal
2006, we added 125 new stores, including 12 stores in China through our acquisition of The Home
Way, and 10 relocations.
Net Cash Used in Financing Activities for fiscal 2006 was $203 million compared with $1.7 billion for
fiscal 2005. The decrease in Net Cash Used in Financing Activities was primarily due to net proceeds
of $7.6 billion from the issuance of additional long-term debt, partially offset by a net increase of
$4.2 billion in Repurchases of Common Stock and Cash Dividends Paid to Stockholders.
In February 2006, May 2006 and August 2006, our Board of Directors authorized an additional
$1.0 billion, $2.0 billion and $3.5 billion, respectively, in our share repurchase program, bringing the
total authorization by our Board of Directors since inception of the program in 2002 to $17.5 billion as
of January 28, 2007. Pursuant to this authorization, we have repurchased approximately 451 million
shares of our common stock for a total of $16.4 billion as of January 28, 2007. During fiscal 2006, we
repurchased approximately 174 million shares of our common stock for $6.7 billion and during fiscal
2005 we repurchased approximately 76 million shares of our common stock for $3.0 billion. As of
January 28, 2007, approximately $1.1 billion remained under our share repurchase program. During
fiscal 2006, we also increased dividends paid by 62.8% to $1.4 billion from $857 million in fiscal 2005.
We have a commercial paper program that allows for borrowings up to $2.5 billion. In connection with
the program, we have a back-up credit facility with a consortium of banks for borrowings up to
$2.0 billion. As of January 28, 2007, there were no borrowings outstanding under the commercial paper
program or the credit facility. The credit facility, which expires in December 2010, contains various
restrictions, none of which is expected to impact our liquidity or capital resources.
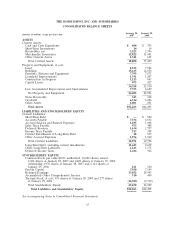
We use capital and operating leases to finance a portion of our real estate, including our stores,
distribution centers, HD Supply locations and store support centers. The net present value of capital
lease obligations is reflected in our Consolidated Balance Sheets in Long-Term Debt. In accordance
with generally accepted accounting principles, the operating leases are not reflected in our
Consolidated Balance Sheets. As of the end of fiscal 2006, our long-term debt-to-equity ratio was
46.5% compared to 9.9% at the end of fiscal 2005. This increase reflects the net increase in Long-Term
Debt as a result of the issuance of Senior Notes in March and December of fiscal 2006.
As of January 28, 2007, we had $614 million in Cash and Short-Term Investments. We believe that our
current cash position and cash flow generated from operations should be sufficient to enable us to
complete our capital expenditure programs and any required long-term debt payments through the next
several fiscal years. In addition, we have funds available from the $2.5 billion commercial paper
program and the ability to obtain alternative sources of financing for other requirements.
26