Home Depot 2006 Annual Report Download - page 35
Download and view the complete annual report
Please find page 35 of the 2006 Home Depot annual report below. You can navigate through the pages in the report by either clicking on the pages listed below, or by using the keyword search tool below to find specific information within the annual report.-
 1
1 -
2
-
3
-
4
-
5
-
6
-
7
-
8
-
9
-
10
-
11
-
12
-
13
-
14
-
15
-
16
-
17
-
18
-
19
-
20
-
21
-
22
-
23
-
24
-
 25
25 -
 26
26 -
 27
27 -
 28
28 -
 29
29 -
 30
30 -
 31
31 -
 32
32 -
 33
33 -
 34
34 -
 35
35 -
 36
36 -
 37
37 -
 38
38 -
 39
39 -
 40
40 -
 41
41 -
 42
42 -
 43
43 -
 44
44 -
 45
45 -
46
-
47
-
48
-
49
-
50
-
51
-
52
-
53
-
54
-
55
-
56
-
57
-
58
-
59
-
60
-
61
-
62
-
63
-
64
-
65
-
66
-
67
-
68
-
69
-
70
-
71
-
72
-
73
-
74
-
75
-
76
-
77
-
78
-
79
-
80
-
81
-
82
-
83
-
84
 |
 |
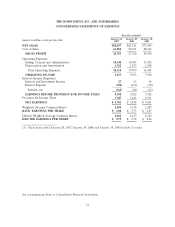
Gross Profit
Gross Profit increased 11.8% to $27.3 billion for fiscal 2005 from $24.4 billion for fiscal 2004. Gross
Profit as a percent of Net Sales increased 10 basis points to 33.5% for fiscal 2005, the highest annual
rate in our Company’s history. Our gross profit margin was impacted by a number of factors during the
year including a change in the mix of merchandise sold, markdowns taken in connection with our
decision to close 20 EXPO stores, the increasing penetration of our HD Supply business and the cost
of our deferred interest programs. For fiscal 2005, the penetration of our private label credit sales was
25.6% compared to 24.1% for fiscal 2004.
Operating Expenses
Operating Expenses increased 8.8% to $18.0 billion for fiscal 2005 from $16.5 billion for fiscal 2004.
Operating Expenses as a percent of Net Sales were 22.0% for fiscal 2005 compared to 22.6% for fiscal
2004.
SG&A increased 8.1% to $16.5 billion for fiscal 2005 from $15.3 billion for fiscal 2004. As a percent of
Net Sales, SG&A was 20.2% for fiscal 2005 compared to 20.9% for fiscal 2004. The reduction of
SG&A as a percent of Net Sales for fiscal 2005 was primarily a result of continued focus on cost
take-out initiatives and driving productivity gains throughout the Company. We also continue to see
benefits from our private label credit card, which carries a lower discount rate than other forms of
credit, like bank cards. In fiscal 2005, we recorded $52 million of income related to gift card breakage
as a reduction of SG&A. Fiscal 2005 was the first year in which we recognized gift card breakage, and
therefore, the amount recognized in fiscal 2005 includes the breakage income related to gift cards sold
since the inception of our gift card program. Finally, for fiscal 2005, we recorded $91 million of
impairment charges and expense related to lease obligations in connection with our decision to close 20
EXPO stores.
Depreciation and Amortization increased 17.9% to $1.5 billion for fiscal 2005 from $1.2 billion for
fiscal 2004. Depreciation and Amortization as a percent of Net Sales was 1.8% for fiscal 2005 and 1.7%
for fiscal 2004. The increase as a percent of Net Sales was primarily due to our investments in store
modernization and technology.
Interest, net
In fiscal 2005, we recognized $81 million of net Interest Expense compared to $14 million in fiscal
2004. Net Interest Expense as a percent of Net Sales was 0.1% for fiscal 2005 and less than 0.1% for
fiscal 2004. Interest Expense increased to $143 million for fiscal 2005 from $70 million for fiscal 2004
primarily due to additional interest incurred related to the August 2005 $1.0 billion issuance of 4.625%
Senior Notes and the September 2004 $1.0 billion issuance of 3.75% Senior Notes. Interest and
Investment Income increased 10.7% to $62 million for fiscal 2005 from $56 million for fiscal 2004 due
primarily to a higher interest rate environment.
Provision for Income Taxes
Our combined federal and state effective income tax rate increased to 37.1% for fiscal 2005 from
36.8% for fiscal 2004. The majority of the increase in our effective income tax rate was due to an
increase in the state effective tax rate in fiscal 2005.
Diluted Earnings per Share
Diluted Earnings per Share were $2.72 and $2.26 for fiscal 2005 and fiscal 2004, respectively. Diluted
Earnings per Share were favorably impacted in both fiscal 2005 and fiscal 2004 as a result of the
repurchase of shares of our common stock.
25