Home Depot 2006 Annual Report Download - page 63
Download and view the complete annual report
Please find page 63 of the 2006 Home Depot annual report below. You can navigate through the pages in the report by either clicking on the pages listed below, or by using the keyword search tool below to find specific information within the annual report.-
 1
1 -
2
-
3
-
4
-
5
-
6
-
7
-
8
-
9
-
10
-
11
-
12
-
13
-
14
-
15
-
16
-
17
-
18
-
19
-
20
-
21
-
22
-
23
-
24
-
25
-
26
-
27
-
28
-
29
-
30
-
31
-
32
-
33
-
34
-
35
-
36
-
37
-
38
-
39
-
40
-
41
-
42
-
43
-
44
-
45
-
46
-
47
-
48
-
49
-
50
-
51
-
52
-
 53
53 -
 54
54 -
 55
55 -
 56
56 -
 57
57 -
 58
58 -
 59
59 -
 60
60 -
 61
61 -
 62
62 -
 63
63 -
 64
64 -
 65
65 -
 66
66 -
 67
67 -
 68
68 -
 69
69 -
 70
70 -
 71
71 -
 72
72 -
 73
73 -
74
-
75
-
76
-
77
-
78
-
79
-
80
-
81
-
82
-
83
-
84
 |
 |

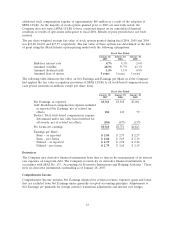
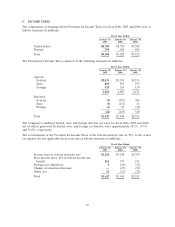
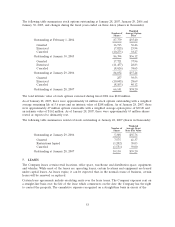
The following table summarizes stock options outstanding at January 28, 2007, January 29, 2006 and
January 30, 2005, and changes during the fiscal years ended on these dates (shares in thousands):
Weighted
Number of Average Option
Shares Price
Outstanding at February 1, 2004 87,779 $35.40
Granted 16,713 36.46
Exercised (7,825) 25.94
Canceled (10,273) 38.27
Outstanding at January 30, 2005 86,394 $36.12
Granted 17,721 37.96
Exercised (11,457) 28.83
Canceled (8,626) 38.65
Outstanding at January 29, 2006 84,032 $37.24
Granted 257 39.53
Exercised (10,045) 28.69
Canceled (8,103) 40.12
Outstanding at January 28, 2007 66,141 $38.20
The total intrinsic value of stock options exercised during fiscal 2006 was $120 million.
As of January 28, 2007, there were approximately 66 million stock options outstanding with a weighted
average remaining life of 5.6 years and an intrinsic value of $248 million. As of January 28, 2007, there
were approximately 47 million options exercisable with a weighted average option price of $39.20 and
an intrinsic value of $162 million. As of January 28, 2007, there were approximately 63 million shares
vested or expected to ultimately vest.
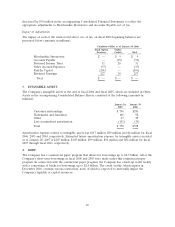
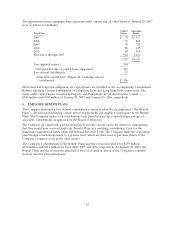
The following table summarizes restricted stock outstanding at January 28, 2007 (shares in thousands):
Weighted
Number of Average Grant
Shares Date Fair Value
Outstanding at January 29, 2006 5,308 $35.76
Granted 7,575 41.37
Restrictions lapsed (1,202) 38.03
Canceled (1,551) 39.00
Outstanding at January 28, 2007 10,130 $39.20
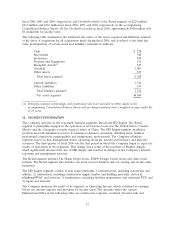
7. LEASES
The Company leases certain retail locations, office space, warehouse and distribution space, equipment
and vehicles. While most of the leases are operating leases, certain locations and equipment are leased
under capital leases. As leases expire, it can be expected that, in the normal course of business, certain
leases will be renewed or replaced.
Certain lease agreements include escalating rents over the lease terms. The Company expenses rent on
a straight-line basis over the life of the lease which commences on the date the Company has the right
to control the property. The cumulative expense recognized on a straight-line basis in excess of the
53